Open Access
Fig. C.4.
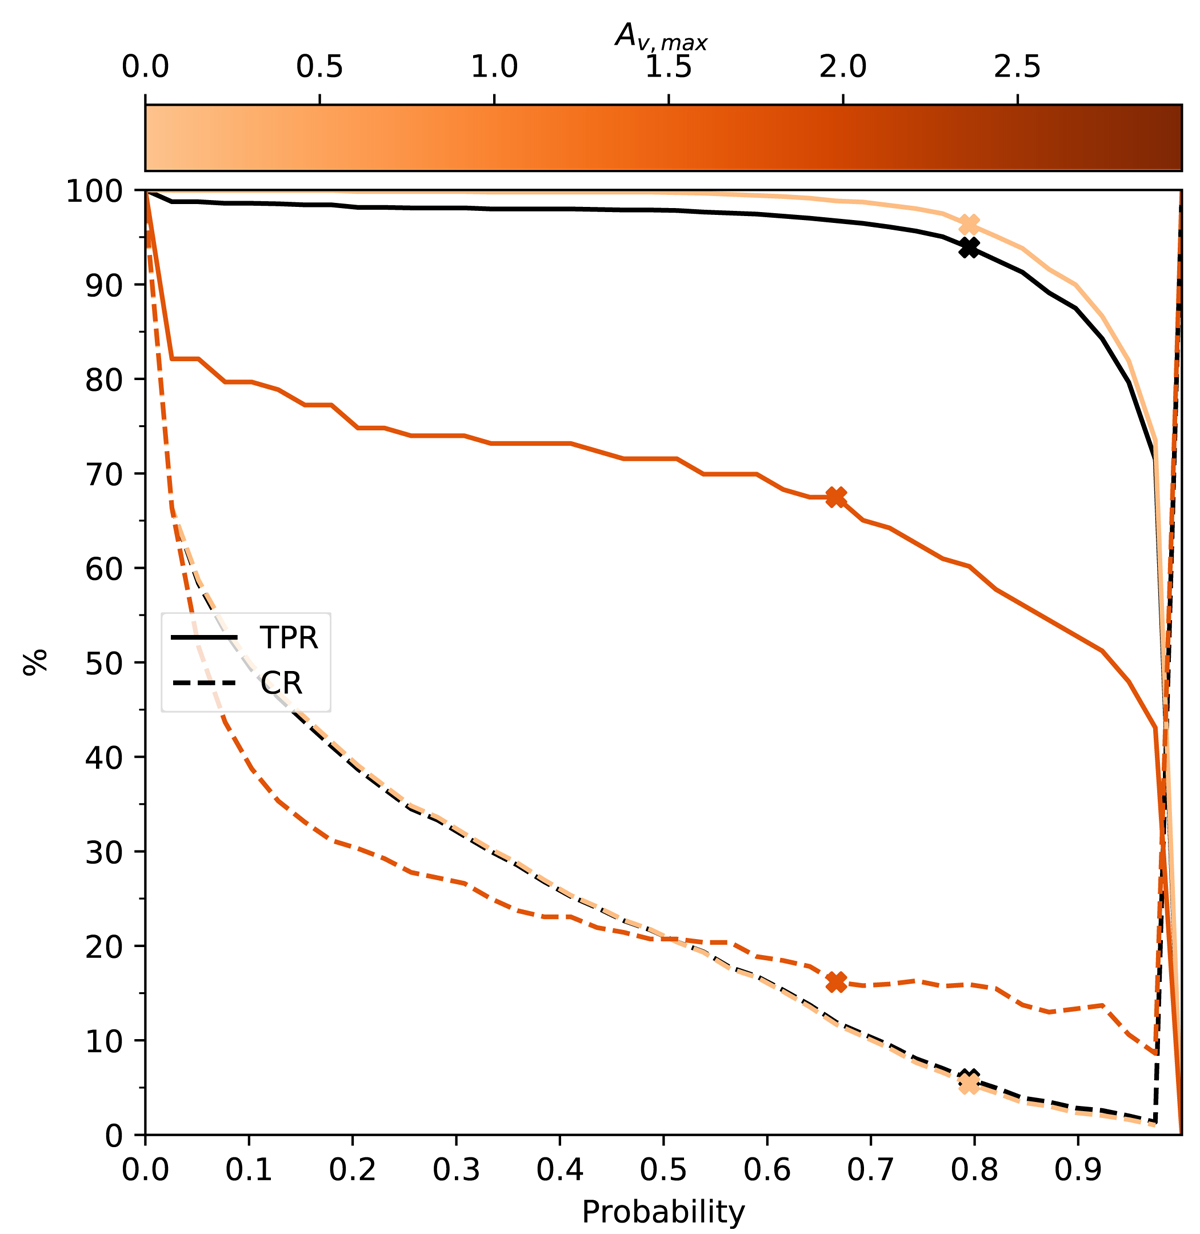
Quality indicators of the classifier obtained from the MAP0 data set. The TPR and CR of the classifier are shown as functions of the probability threshold (black line) and for bins of one magnitude of extinction (color lines).
Current usage metrics show cumulative count of Article Views (full-text article views including HTML views, PDF and ePub downloads, according to the available data) and Abstracts Views on Vision4Press platform.
Data correspond to usage on the plateform after 2015. The current usage metrics is available 48-96 hours after online publication and is updated daily on week days.
Initial download of the metrics may take a while.