Fig. 9
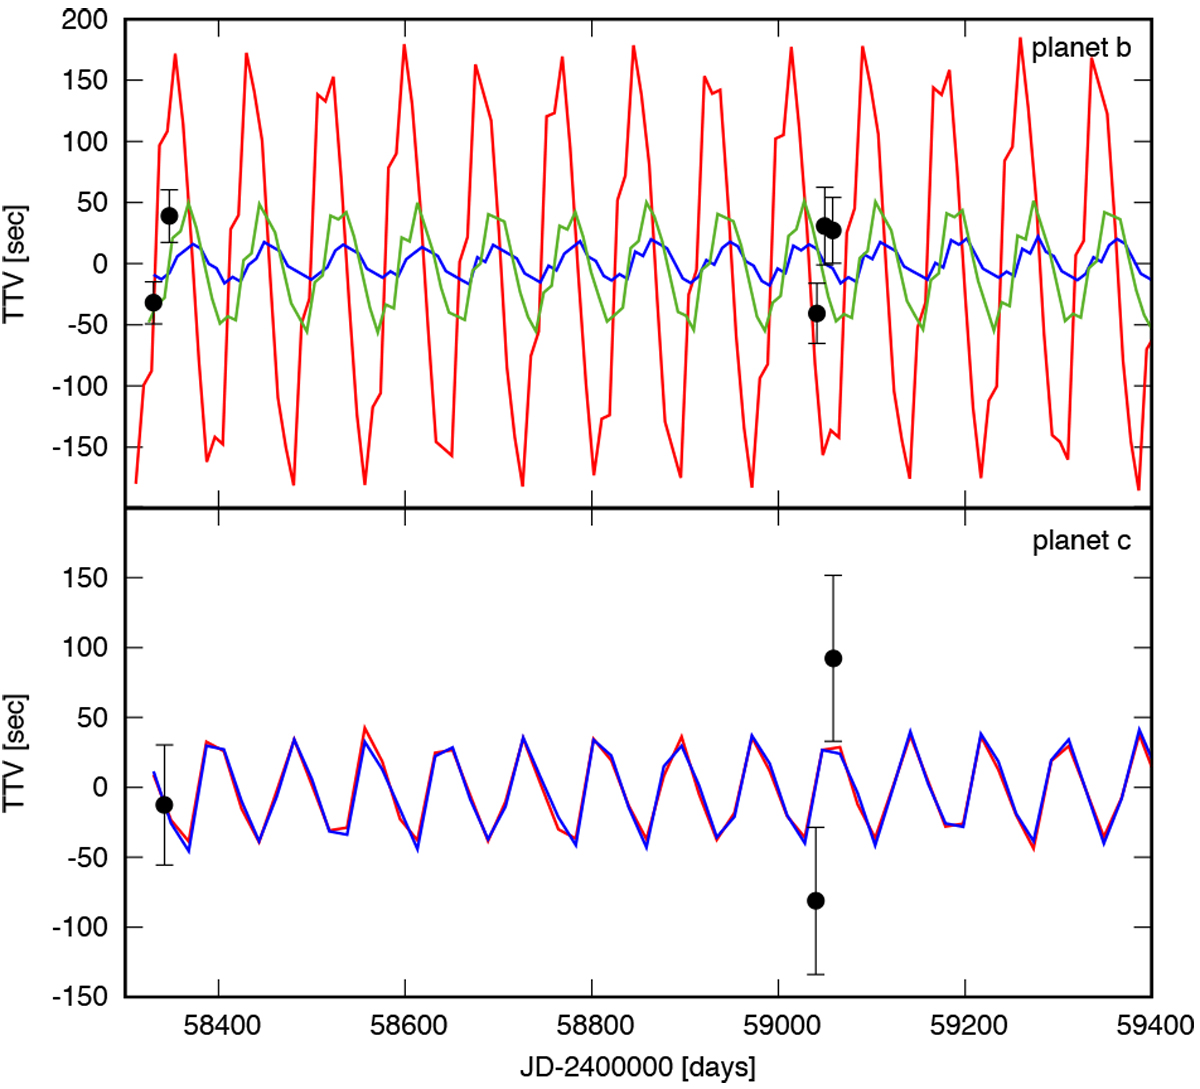
Transit timing variations for AU Mic b (top) and AU Mic c (bottom). The colored lines correspond to synthetic data obtained with the best fit solution (Table 4) using different values for the mass of the outer planet: Mc = 2.2 M⊕ (blue), Mc = 7.0 M⊕ (green), and Mc = 25.0 M⊕ (red). The dots correspond to the observed TTVs. (Table 5).
Current usage metrics show cumulative count of Article Views (full-text article views including HTML views, PDF and ePub downloads, according to the available data) and Abstracts Views on Vision4Press platform.
Data correspond to usage on the plateform after 2015. The current usage metrics is available 48-96 hours after online publication and is updated daily on week days.
Initial download of the metrics may take a while.