Fig. 7
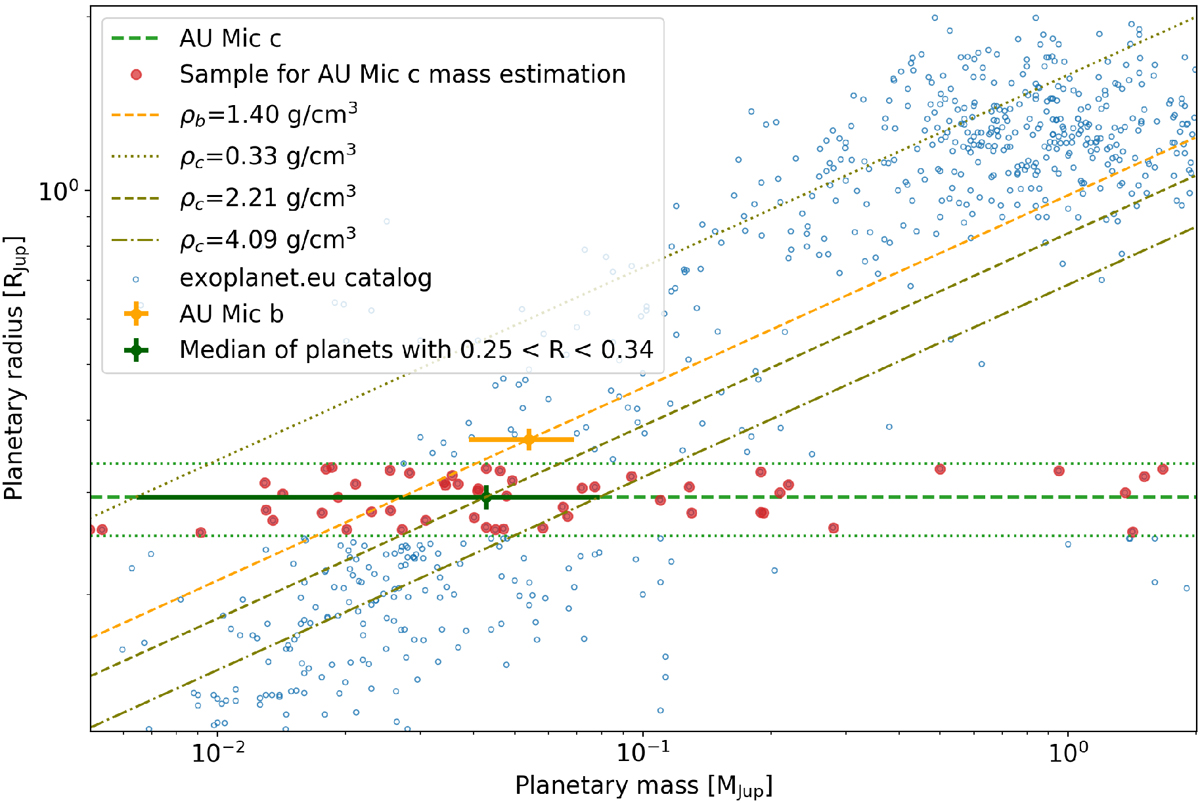
Mass-radius diagram of planets. Blue circles show the known transiting exoplanets compiled from exoplanet.eu. The orange point represents AU Mic b and the light green horizontal dashed and dotted lines represent the AU Mic c radius measurement and ± 1σ uncertainties. Dark green point represents the median of planets with radius within 1σ of the measured radius of AU Mic c. Dashed orange line shows an iso-density line for the radius and mass of AU Mic b and the olive lines correspond to the iso-densities obtained for the radius of AU Mic c and for the lower limit (dotted), median value (dashed), and upper limit (dot-dashed) of the mass of AU Mic c, based on the exoplanet population with the same radii.
Current usage metrics show cumulative count of Article Views (full-text article views including HTML views, PDF and ePub downloads, according to the available data) and Abstracts Views on Vision4Press platform.
Data correspond to usage on the plateform after 2015. The current usage metrics is available 48-96 hours after online publication and is updated daily on week days.
Initial download of the metrics may take a while.