Fig. 3
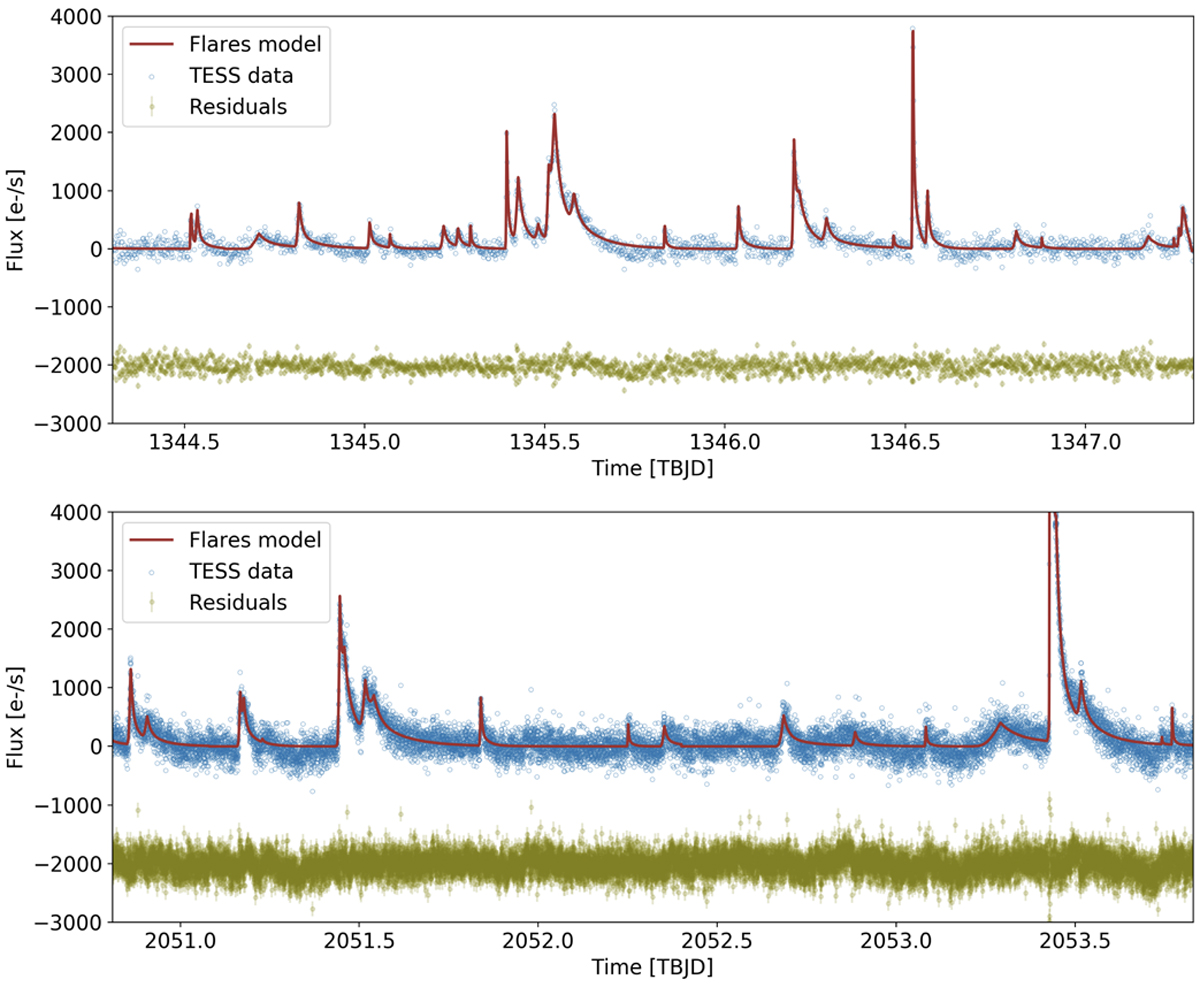
TESS residual light curve of AU Mic between TBJD = 1344.3 and TBJD = 1347.3 (top panel) and between TBJD = 2050.8 and TBJD = 2053.8 (bottom panel). Blue circles show the flux after subtracting the starspot model, brown line shows the multi-flare best fit model. Green points show the residuals with an arbitrary offset for better visualization. The dispersion of residuals are 107 e− s−1 and 178 e−s−1 for data presented in top panel and bottom panel, respectively.
Current usage metrics show cumulative count of Article Views (full-text article views including HTML views, PDF and ePub downloads, according to the available data) and Abstracts Views on Vision4Press platform.
Data correspond to usage on the plateform after 2015. The current usage metrics is available 48-96 hours after online publication and is updated daily on week days.
Initial download of the metrics may take a while.