Fig. C.1
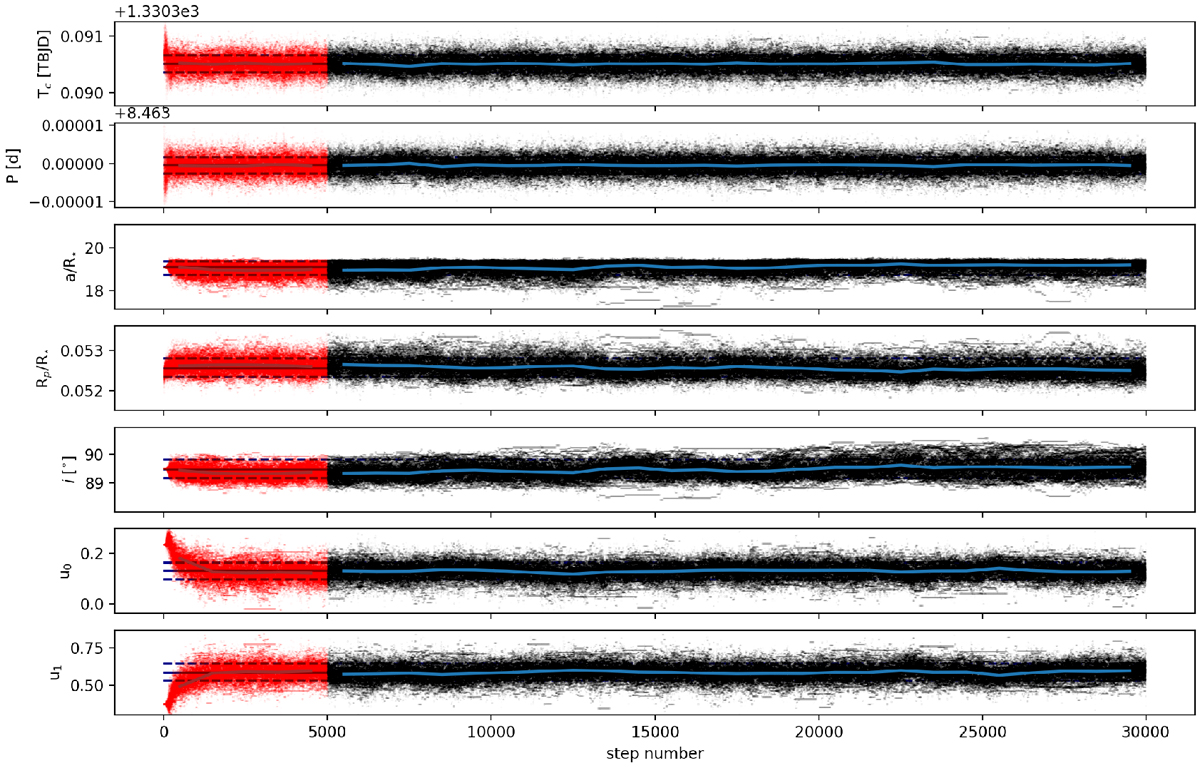
MCMC samples (black dots) used to calculate the posterior distributions of the transit parameters of AU Mic b. The red dots show the discarded samples corresponding to the first 5000 steps of the chain. The blue lines show the median calculated for bins of 1000 steps. Dashed lines show the 16- and 84-percentiles and the solid horizontal lines shows the mediansof the valid samples.)
Current usage metrics show cumulative count of Article Views (full-text article views including HTML views, PDF and ePub downloads, according to the available data) and Abstracts Views on Vision4Press platform.
Data correspond to usage on the plateform after 2015. The current usage metrics is available 48-96 hours after online publication and is updated daily on week days.
Initial download of the metrics may take a while.