Open Access
Fig. A.2
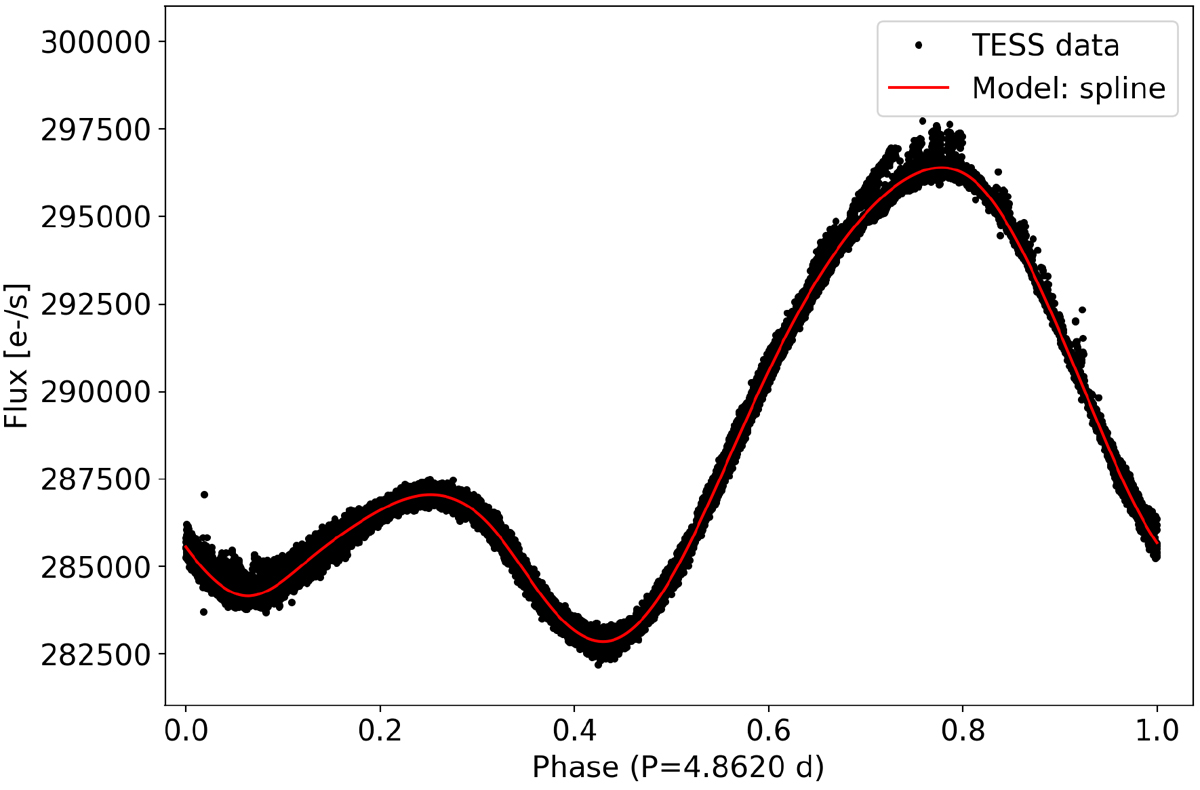
Phased light curve of AU Mic using our measured rotation period of 4.862 d. Black points show the 2018 TESS (first visit only) fluxes after removing the flares and transits best fit models, and red line shows the best fit cubic spline model to the phased data.
Current usage metrics show cumulative count of Article Views (full-text article views including HTML views, PDF and ePub downloads, according to the available data) and Abstracts Views on Vision4Press platform.
Data correspond to usage on the plateform after 2015. The current usage metrics is available 48-96 hours after online publication and is updated daily on week days.
Initial download of the metrics may take a while.