Fig. 1
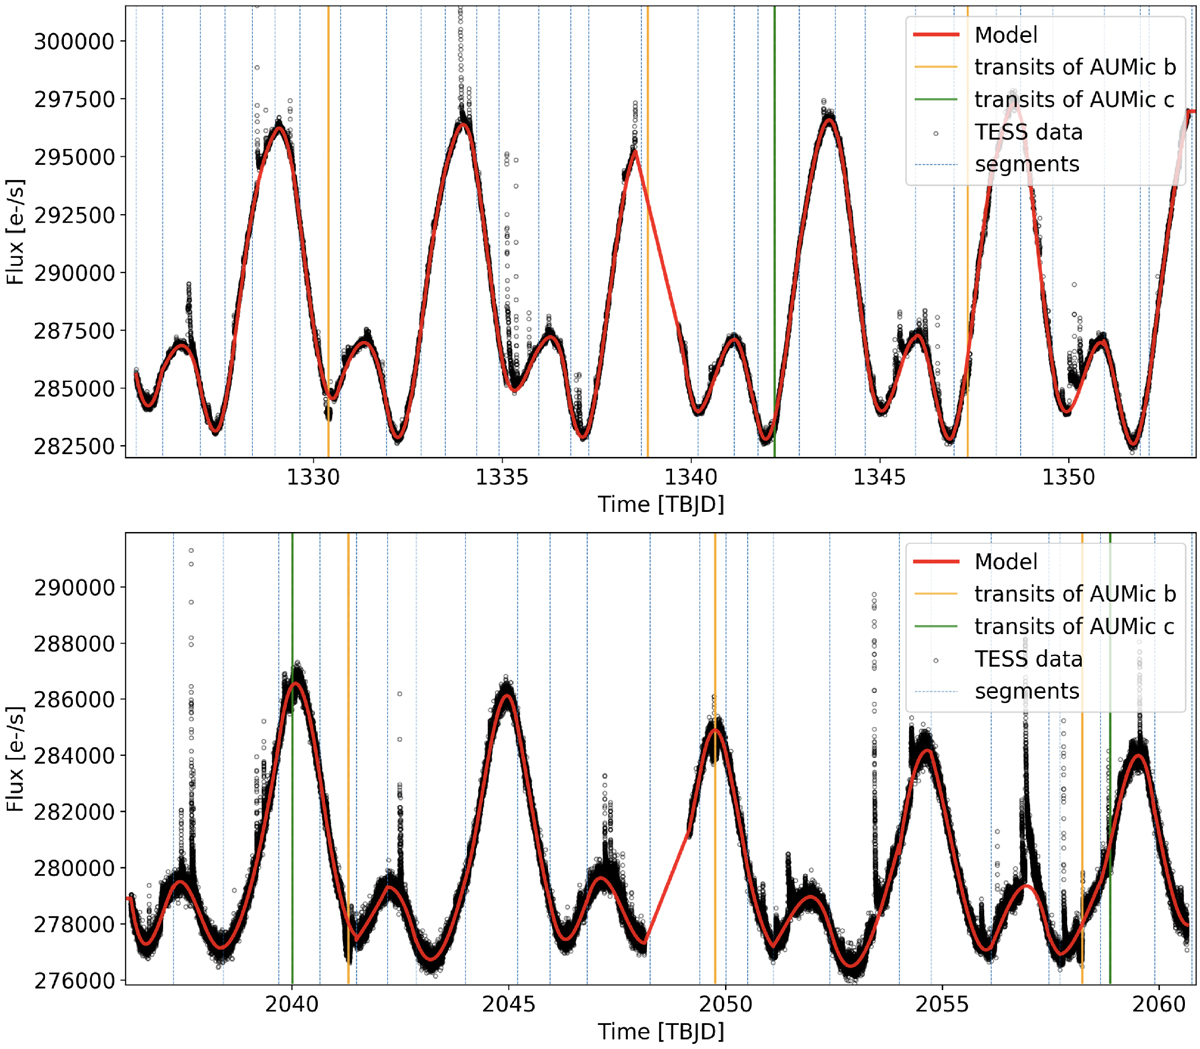
TESS light curve of AU Mic. Top panel: data for the first visit (from 2018-Jul.-25 to 2018-Aug.-22). Bottom panel: data for the second visit (from 2020-Jul.-04 to 2020-Jul.-30). Black points are the PDCSAP flux and vertical solid lines show the times of planetary transits, as obtained in our analysis, for AU Mic b (in orange) and AU Mic c (in green). Blue vertical dashed lines show the knots of selected ranges for the piece-wise polynomial fit and the red line shows the starspot model.
Current usage metrics show cumulative count of Article Views (full-text article views including HTML views, PDF and ePub downloads, according to the available data) and Abstracts Views on Vision4Press platform.
Data correspond to usage on the plateform after 2015. The current usage metrics is available 48-96 hours after online publication and is updated daily on week days.
Initial download of the metrics may take a while.