Fig. 6
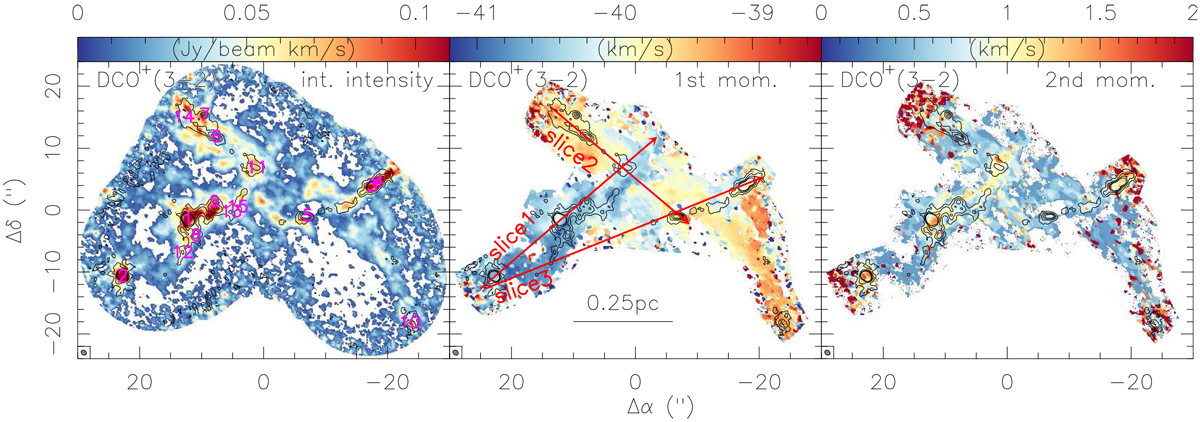
NOEMA+30 m DCO+(3–2) data towards ISOSS22478. The three panels show in color scale the integrated intensity, the 1st and 2nd moment maps (intensity-weighted peak velocities and velocity dispersions), respectively. These maps were produced by clipping all data below an approximate 3σ threshold of 18 mJy beam−1. The contours show the 1.3 mm continuum emission in 3σ steps (1σ ~ 0.057 mJy beam−1) from 3 to 15σ. The beam is shown in the bottom-left of all panels, and a linear scale bar is shown in the middle panel. The red arrows in the middle panel show the three position velocity slices presented in Fig. 8. To reduce noise signatures at the edges of the mosaic, for the 1st and 2nd moment maps, we blanked the mosaic edges. The cores are labeled in the left panel.
Current usage metrics show cumulative count of Article Views (full-text article views including HTML views, PDF and ePub downloads, according to the available data) and Abstracts Views on Vision4Press platform.
Data correspond to usage on the plateform after 2015. The current usage metrics is available 48-96 hours after online publication and is updated daily on week days.
Initial download of the metrics may take a while.