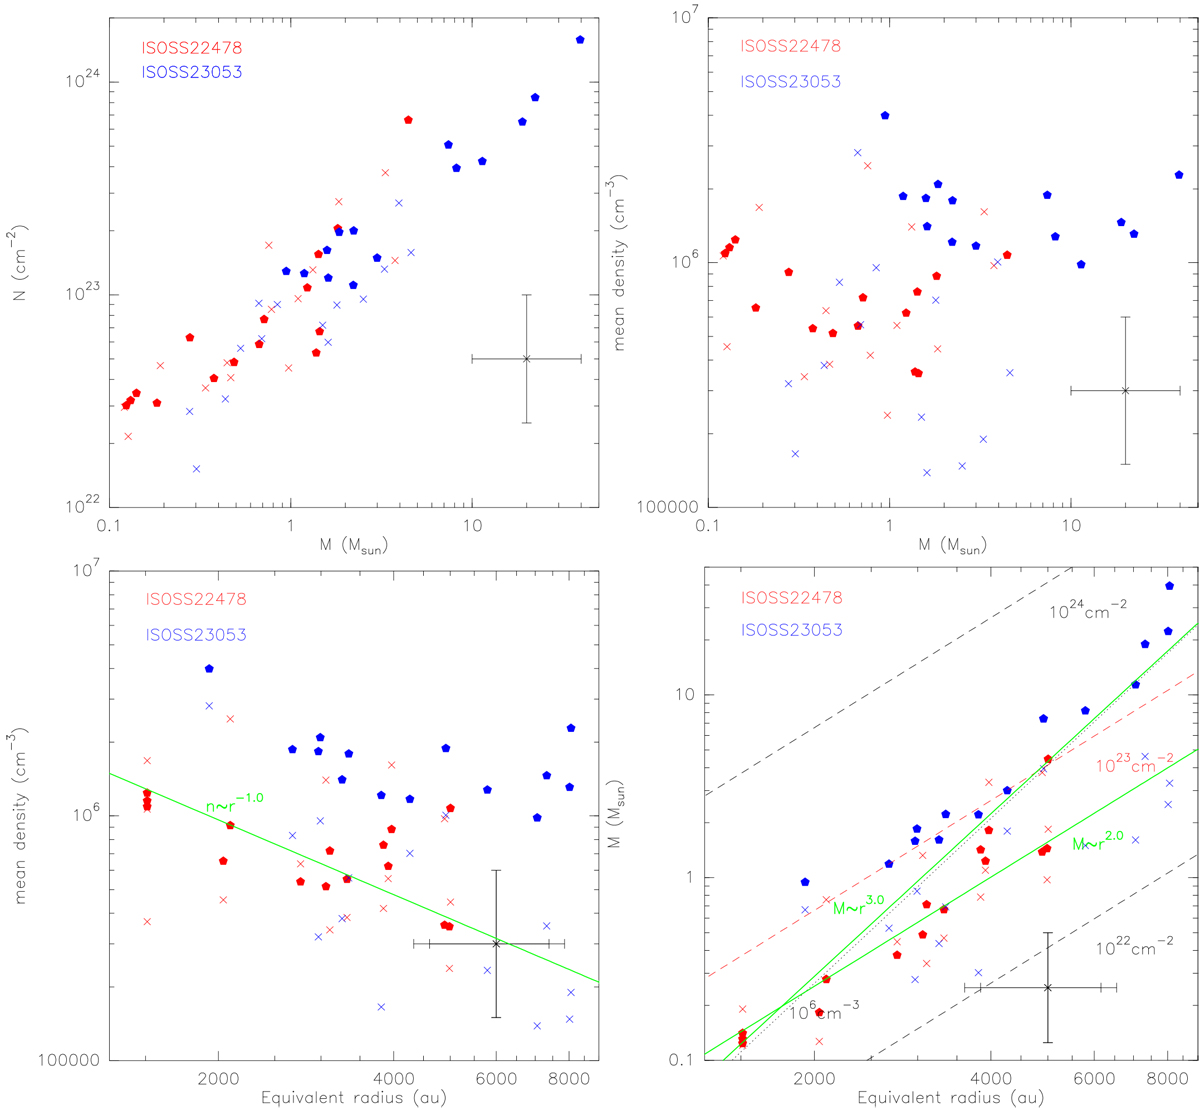
Fig. 4

Relations of core parameters. Top panels: peak column density and mean density plotted against the mass. Bottom panels: mean density and mass plotted against the equivalent radius. The red and blue colors always show the data for ISOSS22478 and ISOSS23053, respectively. The full pentagons show the results estimated assuming constant temperatures (T20K) whereas the crosses present the data assuming the temperatures derived from the H2CO line data (![]() ). The bottom-left panel presents as green line a fit to the data following the
). The bottom-left panel presents as green line a fit to the data following the
![]() approach. Bottom-right panel: fits to the data (green continuous lines) and lines of constant mean column density and constant mean density (dashed and dotted lines, respectively) as labeled in the plot. Respective error-bars in each panel correspond to a factor of 2 uncertainty for masses, column densities, and mean densities, as well as 1 kpc distance uncertainty for the equivalent radii (resulting in the different error-bar end markers for the radii).
approach. Bottom-right panel: fits to the data (green continuous lines) and lines of constant mean column density and constant mean density (dashed and dotted lines, respectively) as labeled in the plot. Respective error-bars in each panel correspond to a factor of 2 uncertainty for masses, column densities, and mean densities, as well as 1 kpc distance uncertainty for the equivalent radii (resulting in the different error-bar end markers for the radii).
Current usage metrics show cumulative count of Article Views (full-text article views including HTML views, PDF and ePub downloads, according to the available data) and Abstracts Views on Vision4Press platform.
Data correspond to usage on the plateform after 2015. The current usage metrics is available 48-96 hours after online publication and is updated daily on week days.
Initial download of the metrics may take a while.


