Fig. 1
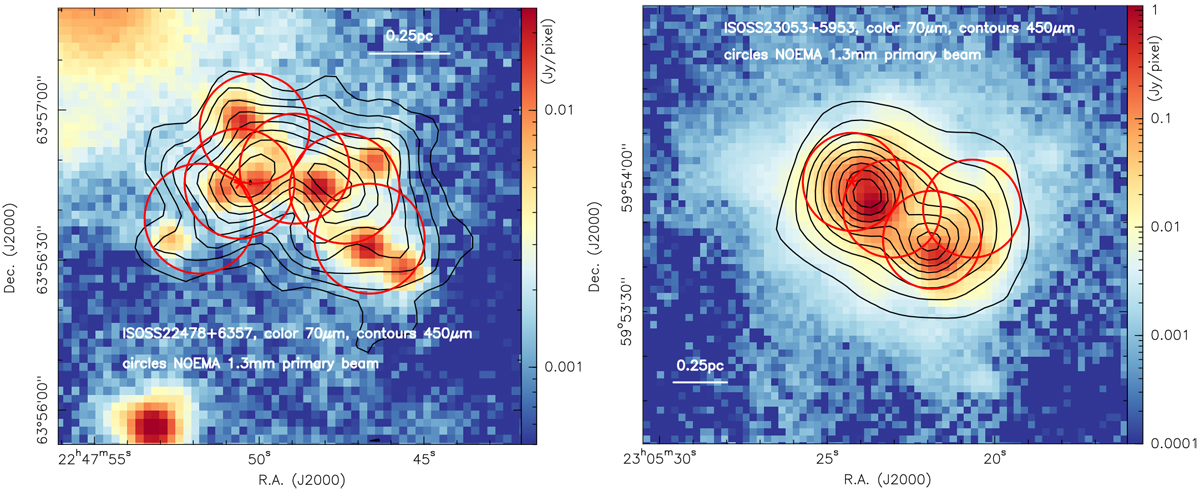
Overview of the ISOSS22478+6357 (left) and ISOSS23053 (right) regions. The color scales and contours show the 70 and 450 μm emission from Herschel and SCUBA, respectively (Ragan et al. 2012; Di Francesco et al. 2008). The contour levels are from 18 to 98% of the peak emission of 1.88 and 14.88 Jy beam−1 for the two regions, respectively. Linear scale bars are shown and the red circles outline the NOEMA mosaics with a primary beam FWHM of 22″.
Current usage metrics show cumulative count of Article Views (full-text article views including HTML views, PDF and ePub downloads, according to the available data) and Abstracts Views on Vision4Press platform.
Data correspond to usage on the plateform after 2015. The current usage metrics is available 48-96 hours after online publication and is updated daily on week days.
Initial download of the metrics may take a while.