Fig. 8.
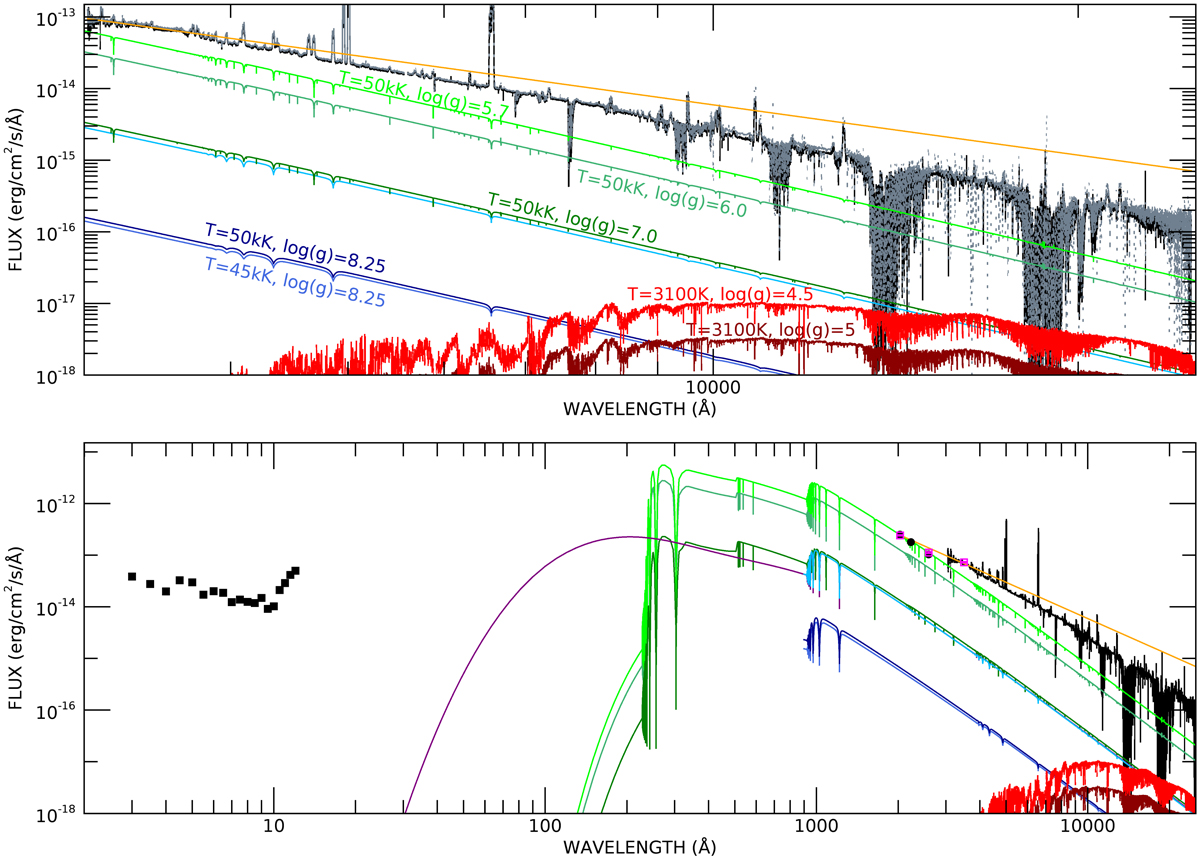
Cen continuum SED and comparison with theoretical models. Top panel: Cen fiducial reference spectrum 4 from night 1 (solid black line) and the fiducial spectrum 8 from night 2 (dotted gray line). Both have been corrected for reddening. The solid orange line represents a power law of power −7/3, as predicted for steady state accretion disks; all the other colored lines are stellar atmosphere models. Their temperatures and gravities are marked in the figure itself (shade of blues for the Koester WD models; shades of green for the Tubingen database stellar atmospheres; shades of red for the Next Generation NLTE cool stars models). Bottom panel: fiducial reference spectrum 4 from night 1 together with the Swift UVOT photometry (filled black circle for the April 2019 observation; open magenta squares for the June 2019 observations), the Chandra spectrum, the same models as in the top panel, and a T = 50 kK log g = 7.0 model with solar abundances (magenta line; Tubingen database).
Current usage metrics show cumulative count of Article Views (full-text article views including HTML views, PDF and ePub downloads, according to the available data) and Abstracts Views on Vision4Press platform.
Data correspond to usage on the plateform after 2015. The current usage metrics is available 48-96 hours after online publication and is updated daily on week days.
Initial download of the metrics may take a while.