Fig. 6.
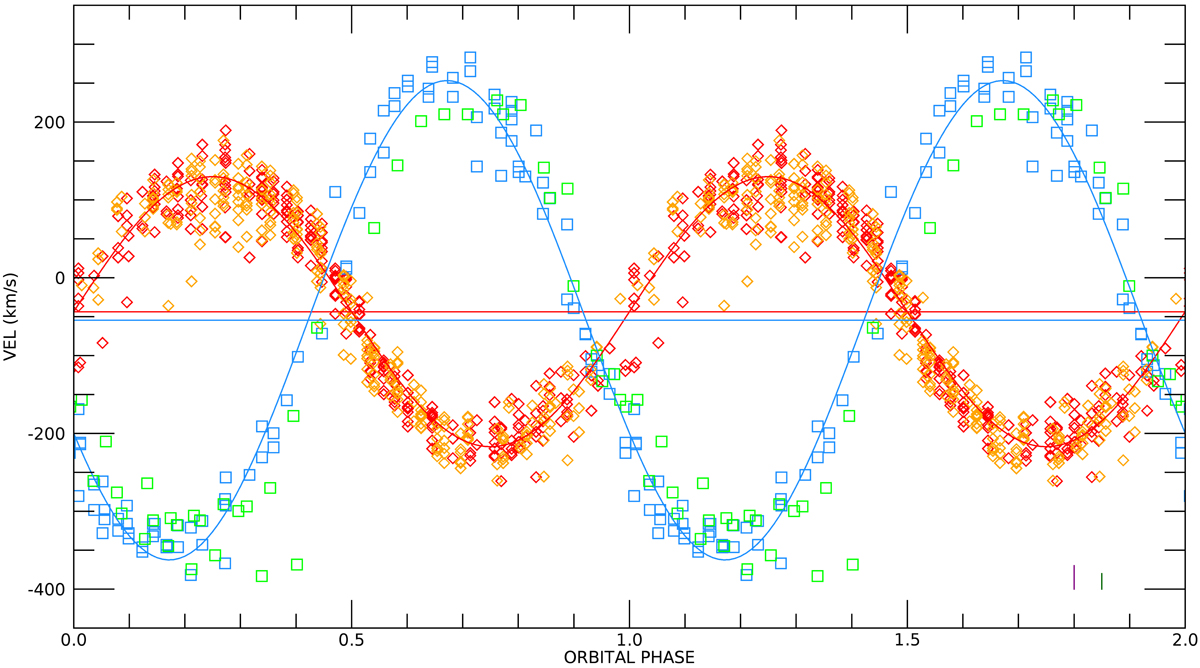
Radial velocities of the s-wave (red and orange diamonds for night 1 and night 2, respectively) and of the fuzzball-wave (blue and green squares for night 1 and night 2, respectively). The red sine curve and horizontal lines are the night 1 best fit radial and γ velocity for the s-wave, respectively (see Sect. 3.2.1 for details). The blue sine curve and horizontal line are the night 1 best fit radial and γ velocity, respectively, for the fuzzball emission (see Sect. 3.2.2 for details). The two vertical bars on the bottom right corner of the panel represent the radial velocity measurement 1σ uncertainties: 30 km s−1 in purple for the UVB arm measurements and 20 km s−1 in dark green for the VIS arm measurements.
Current usage metrics show cumulative count of Article Views (full-text article views including HTML views, PDF and ePub downloads, according to the available data) and Abstracts Views on Vision4Press platform.
Data correspond to usage on the plateform after 2015. The current usage metrics is available 48-96 hours after online publication and is updated daily on week days.
Initial download of the metrics may take a while.