Fig. 5.
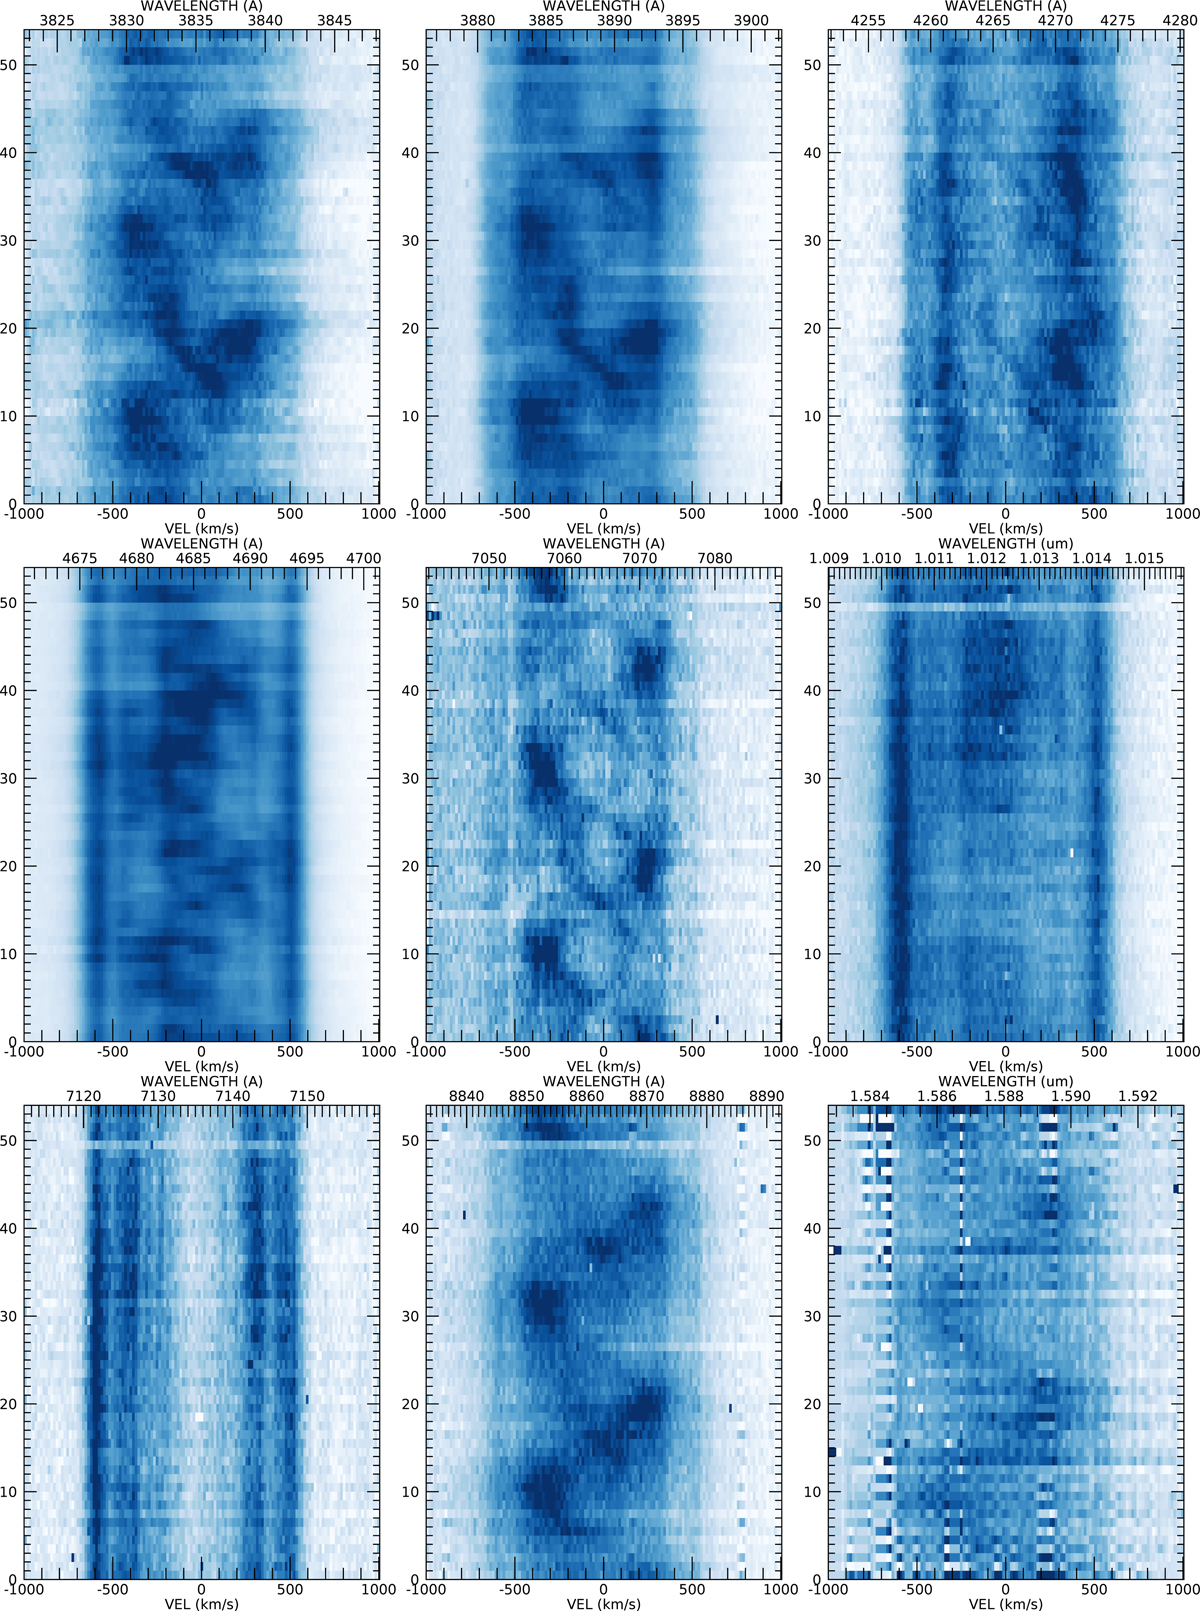
Selected trailed spectrograms from night 1. Darker regions indicate stronger emission (linear intensity scale). From top to bottom and left to right: Hη, Hζ, C II λ4266, He II λ4686, He Iλ7065, He II λ10123, [Ar III] λ7135, H Paschen λ8862, and H Brackett λ15880. The y-axis in each panel indicates the spectrum number in the night time series. The fuzzballs are particularly evident at maximum blueshift around spectra 10 and 30, as well as at maximum redshift around spectra ∼20 and 40 in the Hη, Hζ, He Iλ7065, and H Paschen λ8862 lines.
Current usage metrics show cumulative count of Article Views (full-text article views including HTML views, PDF and ePub downloads, according to the available data) and Abstracts Views on Vision4Press platform.
Data correspond to usage on the plateform after 2015. The current usage metrics is available 48-96 hours after online publication and is updated daily on week days.
Initial download of the metrics may take a while.