Free Access
Fig. 3.
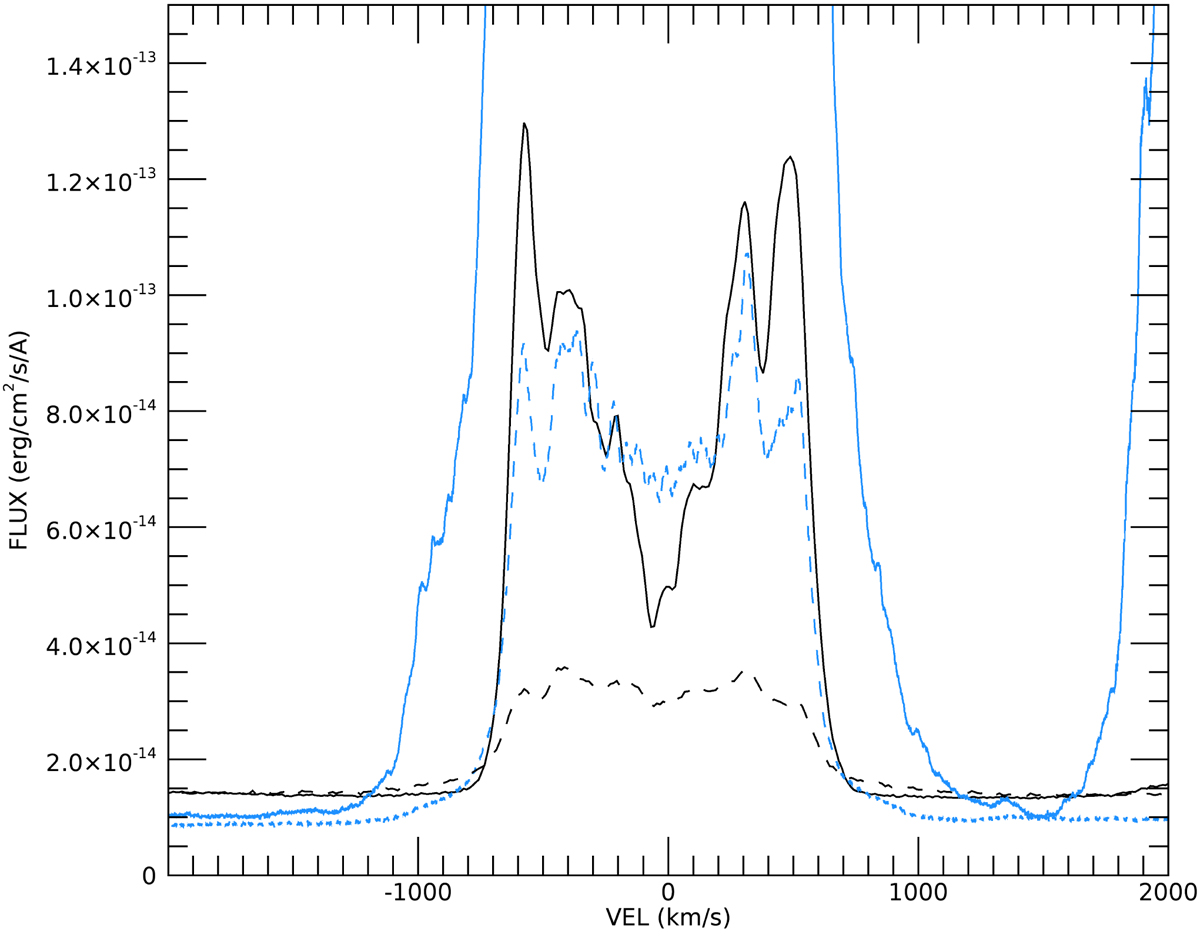
[O III] λ4959 and Hβ line profiles in April 2019 (solid and dashed black lines, respectively), together with the same line profiles from March 2016 (blue lines) showing the change of the emission measure per velocity bin. The [O III] emission lines were about ten times stronger in 2016 than in 2019.
Current usage metrics show cumulative count of Article Views (full-text article views including HTML views, PDF and ePub downloads, according to the available data) and Abstracts Views on Vision4Press platform.
Data correspond to usage on the plateform after 2015. The current usage metrics is available 48-96 hours after online publication and is updated daily on week days.
Initial download of the metrics may take a while.