Fig. 2.
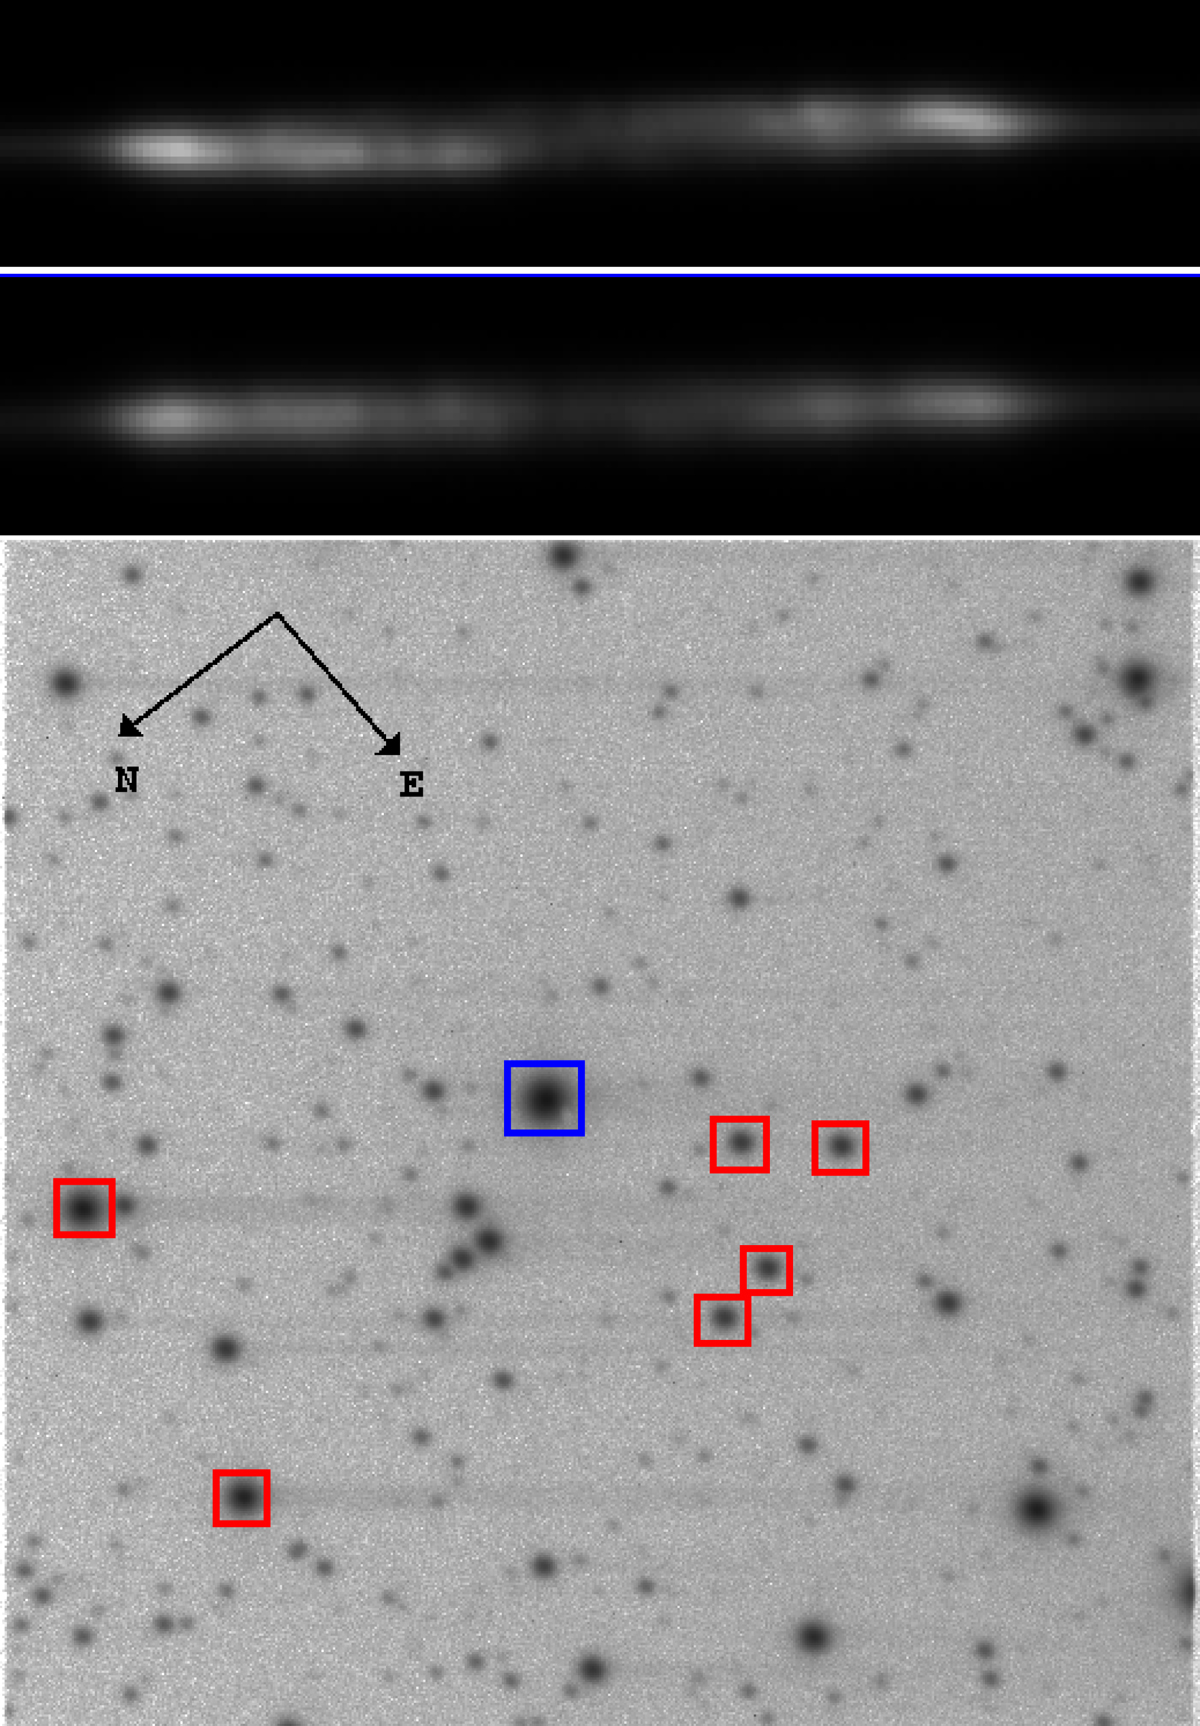
Analysis of the X-shooter images. Top: examples of the [O III]λ4959 emission line as observed in the 2D raw frames. The bright spots correspond to the line structures (i.e., peaks) in the Fig. 3 profile. The wavelength increases from left to right. Bottom: X-shooter acquisition frame. The blue square encloses Cen, while the red ones cover the comparison stars that were used to estimate the seeing PSF. The field shown is 1.47 arcmin squared.
Current usage metrics show cumulative count of Article Views (full-text article views including HTML views, PDF and ePub downloads, according to the available data) and Abstracts Views on Vision4Press platform.
Data correspond to usage on the plateform after 2015. The current usage metrics is available 48-96 hours after online publication and is updated daily on week days.
Initial download of the metrics may take a while.