Free Access
Fig. 10.
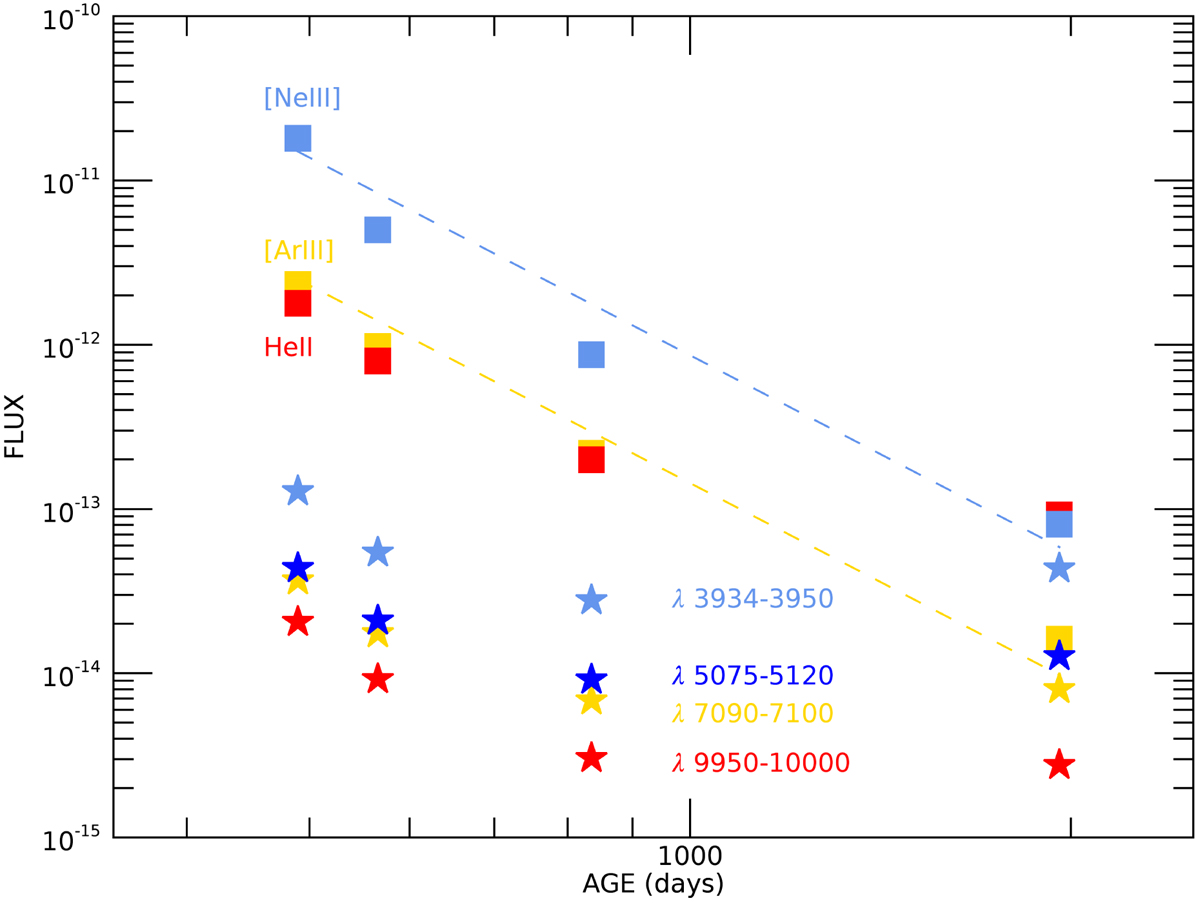
Flux decline rate from day 489 to 1958 as measured in a portion of the continuum (star symbols) as well as in selected emission lines (square symbols): two nebular lines ([Ne III]λ3869 and [Ar III]λ7135) and a permitted one (He II λ10124).
Current usage metrics show cumulative count of Article Views (full-text article views including HTML views, PDF and ePub downloads, according to the available data) and Abstracts Views on Vision4Press platform.
Data correspond to usage on the plateform after 2015. The current usage metrics is available 48-96 hours after online publication and is updated daily on week days.
Initial download of the metrics may take a while.