Fig. 6
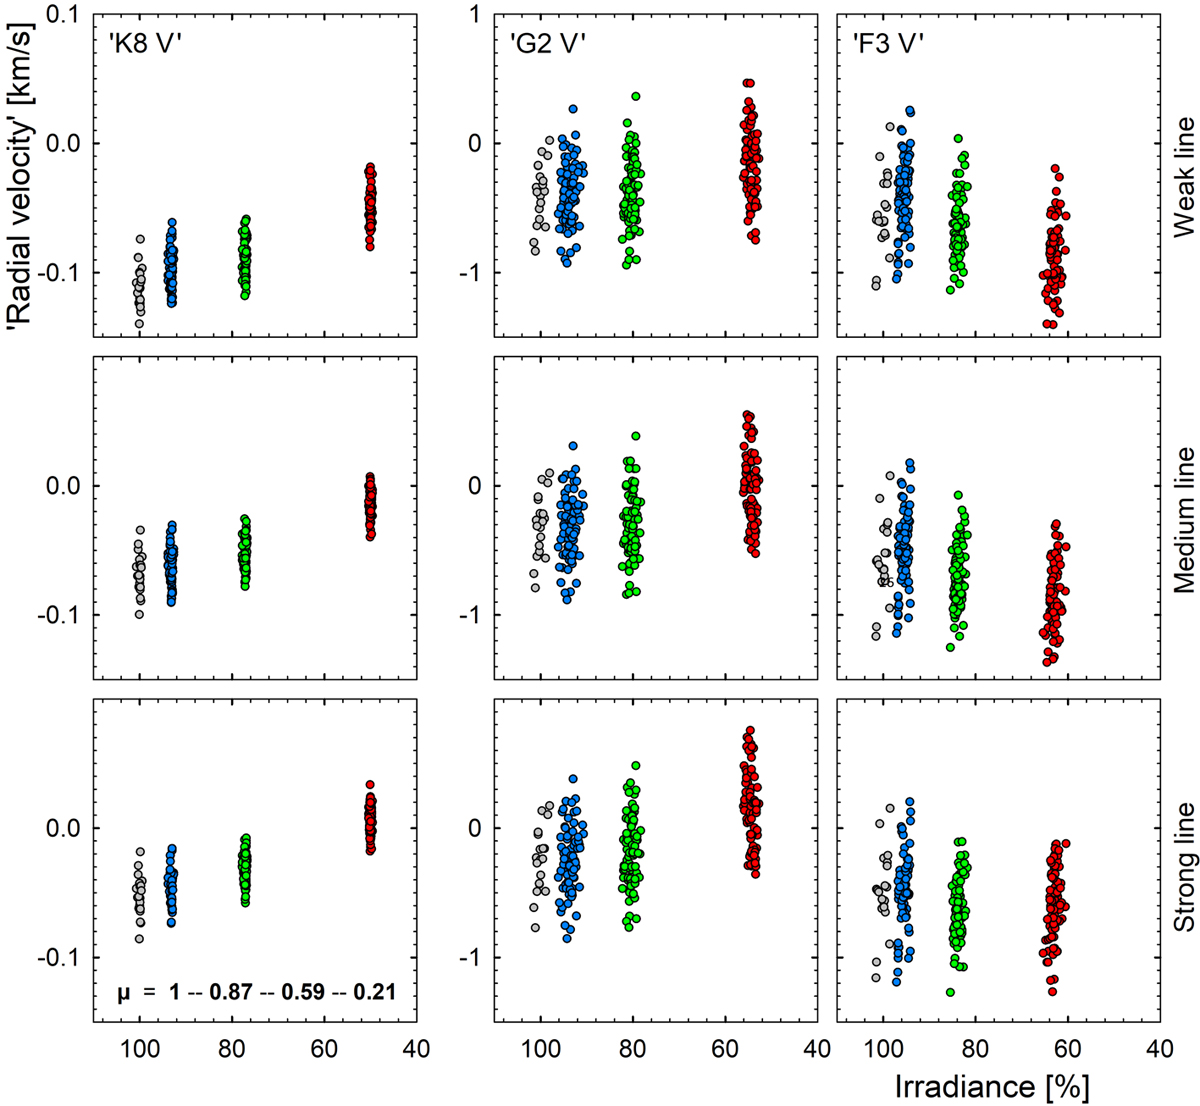
Range of jittering in wavelength shift for (left to right) the ‘K8 V’, ‘G2 V’, and ‘F3 V’ models as a function of the surface irradiance at different times during each simulation. The velocity scale for the cool and quiet ‘K8 V’ model is expanded tenfold relative to the others. This plot is (from top down) for idealized weak, medium, and strong Fe I lines of χ = 3 eV at λ 630 nm. The four disk positions of μ = 1, 0.87, 0.59, and 0.21 are left to right inside each frame and marked in gray, blue, green and red. The number of points is four times greater for off-center positions than for μ = 1 because those are sampled at four different azimuth angles. Irradiance is in units of the time-averaged disk-center continuum flux at λ 630 nm in each model.
Current usage metrics show cumulative count of Article Views (full-text article views including HTML views, PDF and ePub downloads, according to the available data) and Abstracts Views on Vision4Press platform.
Data correspond to usage on the plateform after 2015. The current usage metrics is available 48-96 hours after online publication and is updated daily on week days.
Initial download of the metrics may take a while.