Fig. 5
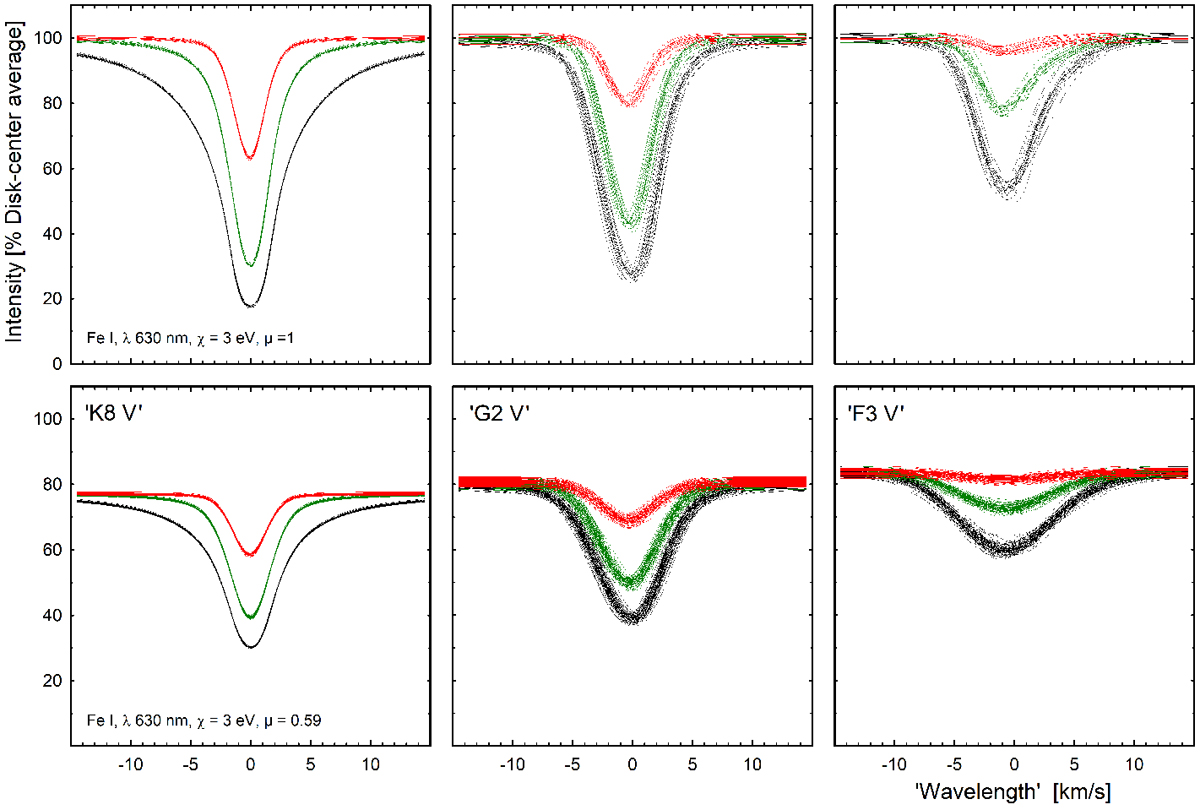
Spatially averaged but temporally resolved line profiles from (left to right) the ‘K8 V’, ‘G2 V’, and ‘F3 V’ models at stellar disk center (top row) and at disk position μ = 0.59 (bottom). Within each frame, spectral lines of three different strengths are shown: weak, medium and strong (red, green and black). Profiles from some 20 instances in time during the modeling sequences are plotted for an idealized Fe I line with χ = 3 eV at λ 630 nm. The number of profiles is greater for off-center data at μ = cos θ = 0.59, which at each instance in time include profiles at four different azimuth angles (quadrants on the star). To discern the subtle variability in the ‘K8 V’ simulation, this figure should be viewed highly magnified.
Current usage metrics show cumulative count of Article Views (full-text article views including HTML views, PDF and ePub downloads, according to the available data) and Abstracts Views on Vision4Press platform.
Data correspond to usage on the plateform after 2015. The current usage metrics is available 48-96 hours after online publication and is updated daily on week days.
Initial download of the metrics may take a while.