Fig. 3
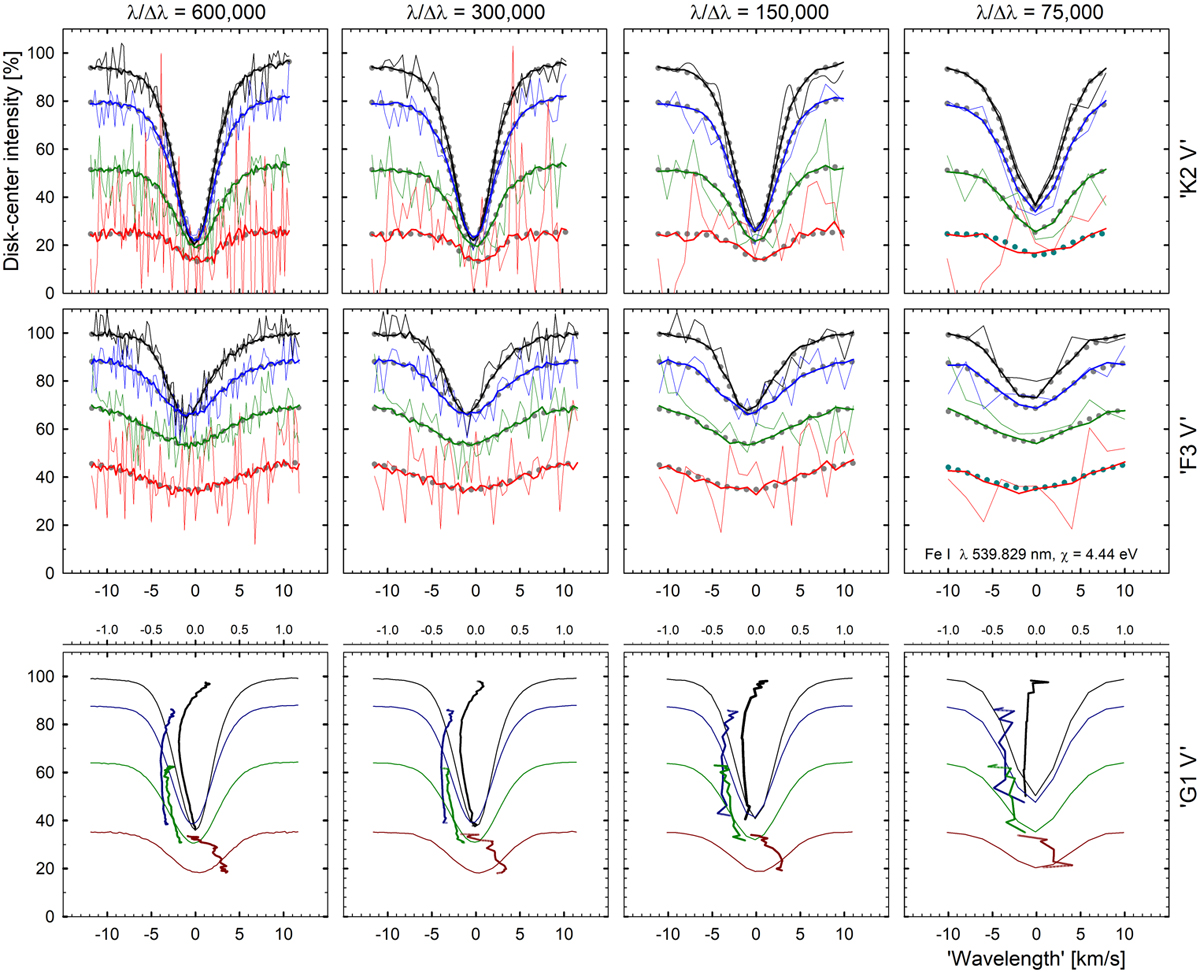
Simulated noise in spatially resolved line profile reconstructions from observations during an exoplanet transit. Columns from left to right: reconstructions from resolutions λ/Δλ = 600 000, 300 000, 150 000 and 75 000, sampled with two pixels per spectral resolution element. Two top rows: cooler ‘K2 V’ and a hotter ‘F3 V’ star, differing in line strengths, widths, and limb darkening. Photometric noise levels during transit in the spectral continuum are: σ = 0.01% (thin line) and 0.001% (bold). Noise-free profiles at each resolution are plotted as gray dots. Inside each frame and top down, profiles are for disk center positions μ = 1, 0.79, 0.41, and 0.09. Bottom row: reconstructed profiles at the extremely low noise level of σ = 0.0001%, which is required to also recover well the bisectors (tenfold expanded scale at top).
Current usage metrics show cumulative count of Article Views (full-text article views including HTML views, PDF and ePub downloads, according to the available data) and Abstracts Views on Vision4Press platform.
Data correspond to usage on the plateform after 2015. The current usage metrics is available 48-96 hours after online publication and is updated daily on week days.
Initial download of the metrics may take a while.