Fig. 2
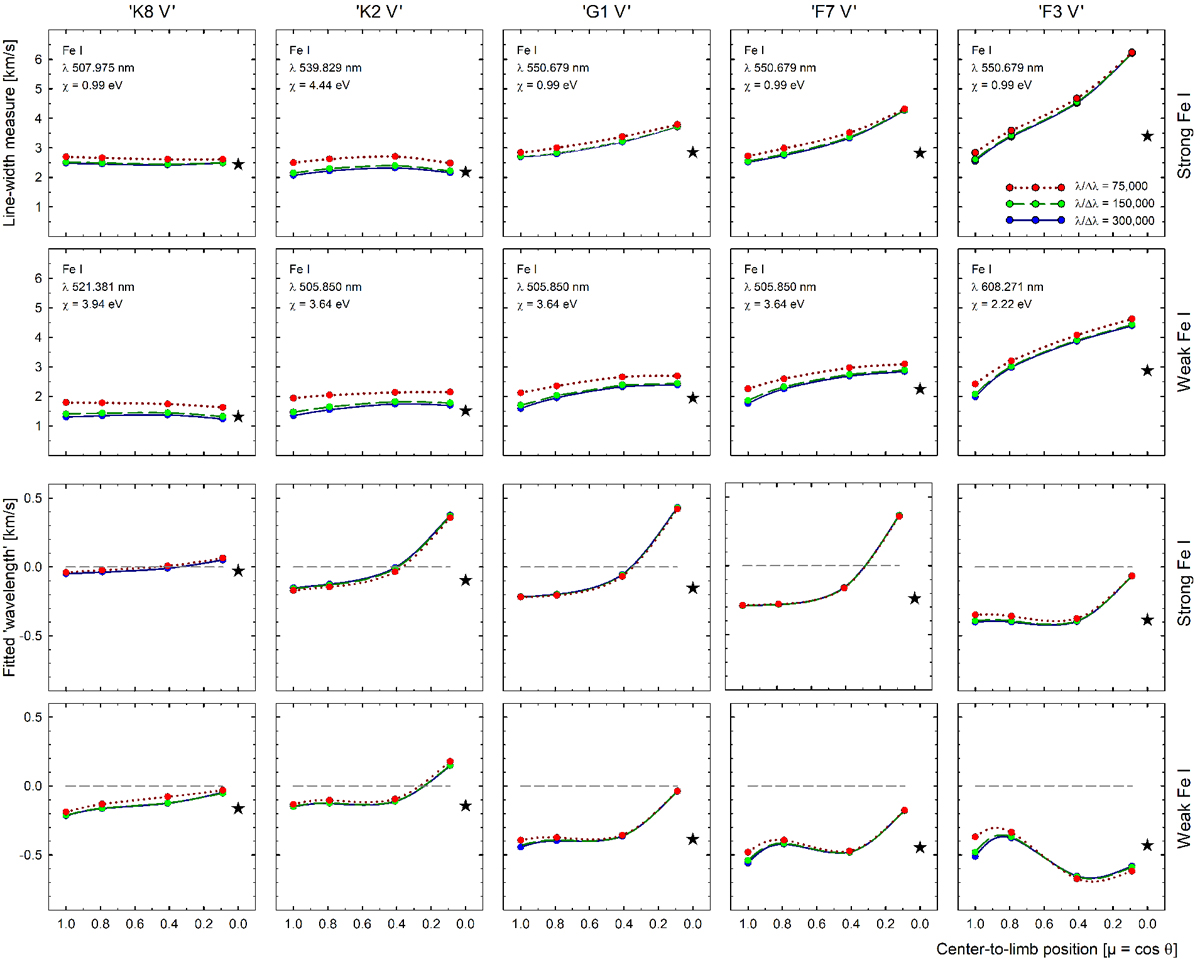
Parameters obtained from fitting full line profiles at various spectral resolutions in different stars. Top rows: fitted line widths for one weak and one strong line at different stellar disk positions. Bottom rows: corresponding wavelength shifts. The values were obtained from fitting five-parameter Gaussian-type functions to the line profiles. Black stars denote values for integrated full-disk flux from 3D models at full hyper-high spectral resolution. Solid curves with blue symbols denote λ∕Δλ = 300 000, dashed lineswith green symbols show 150 000, and dotted curves with red symbols plot the lowest resolution of 75 000.
Current usage metrics show cumulative count of Article Views (full-text article views including HTML views, PDF and ePub downloads, according to the available data) and Abstracts Views on Vision4Press platform.
Data correspond to usage on the plateform after 2015. The current usage metrics is available 48-96 hours after online publication and is updated daily on week days.
Initial download of the metrics may take a while.