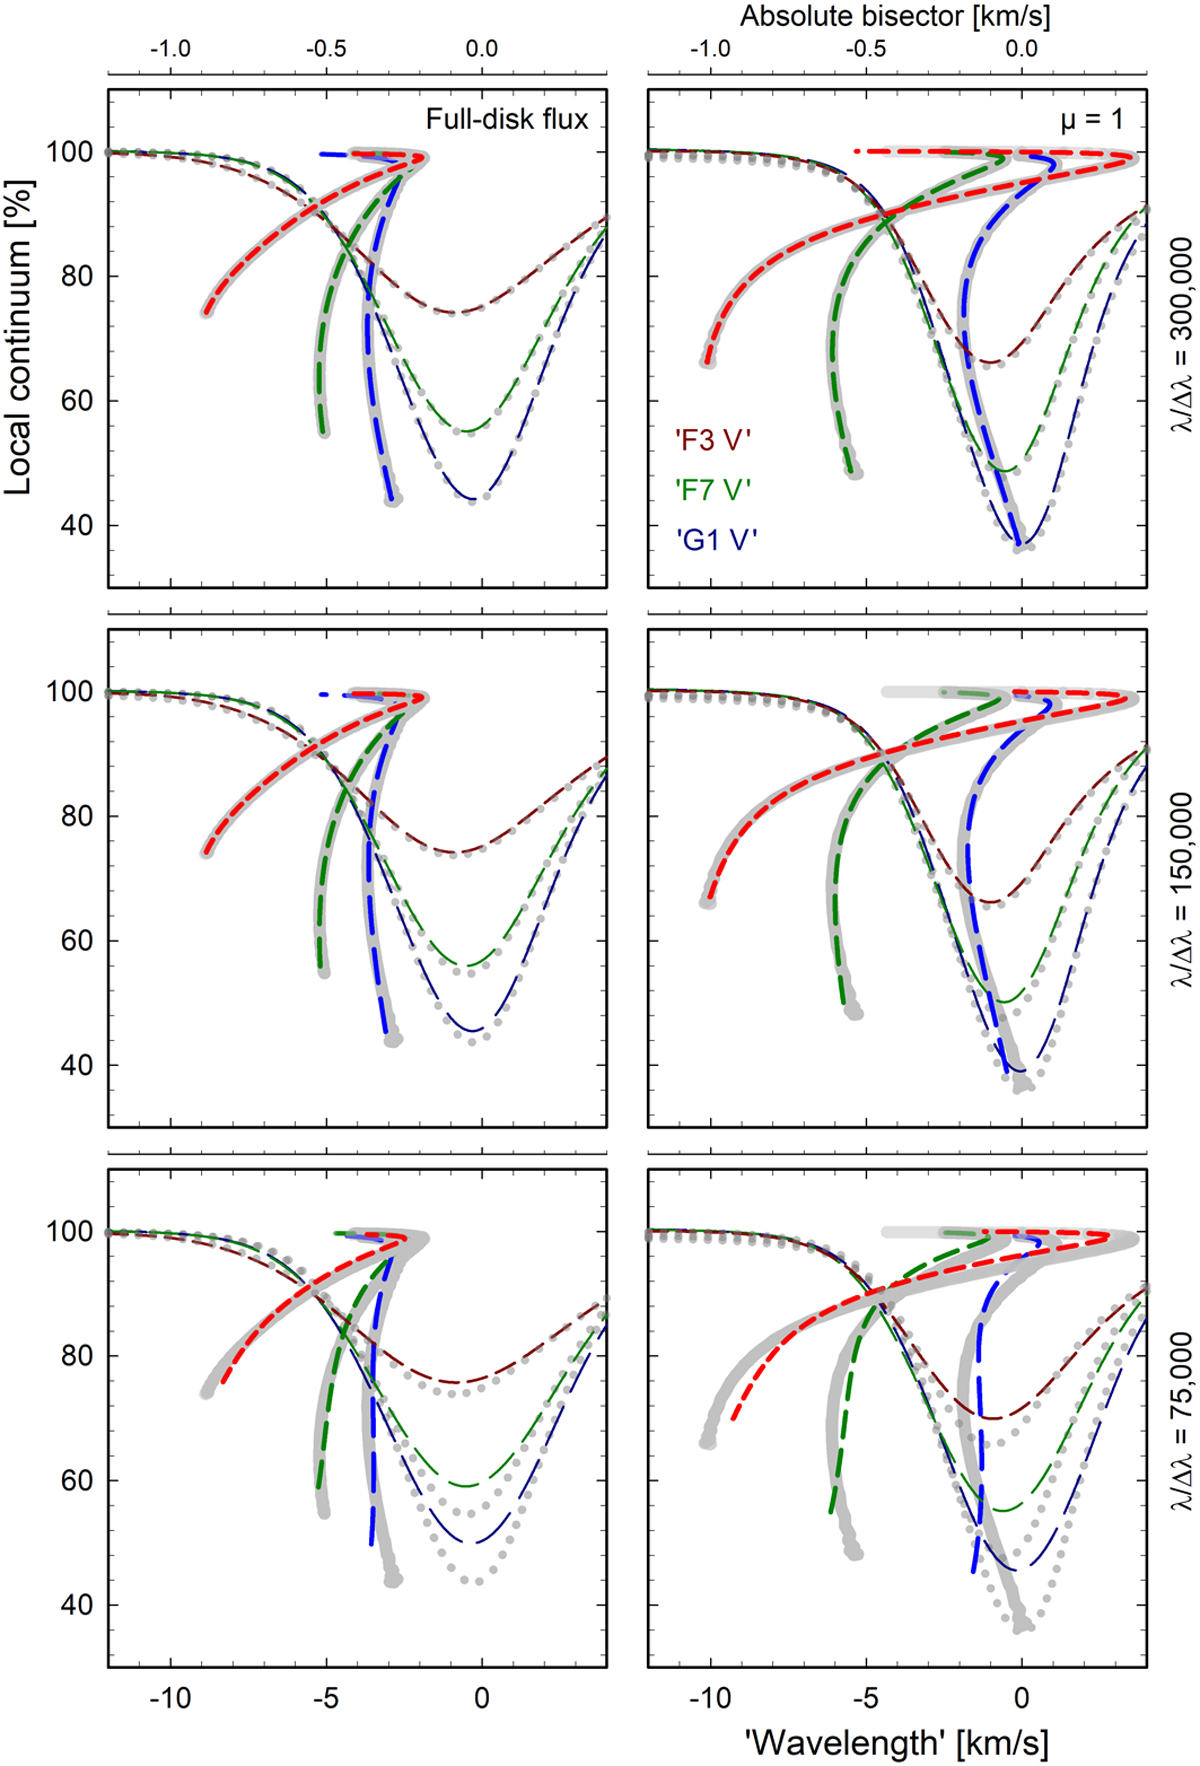
Fig. 1
Effects of decreasing spectral resolution on line profiles (axes at the bottom) and their bisectors (tenfold expanded axes at the top) for a representative spectral line. From the top down, three rows show the Fe I λ 539.8286 nmline for λ∕Δλ = 300 000, 150 000, and 75 000. Left column: data for integrated full-disk flux. Right column: for stellar disk center (μ = 1). The same Fe I line is shown in models for ‘F3 V’, ‘F7 V’, and ‘G1 V’ as short-, medium-, and long-dashed lines (red, green, and blue). Each frame also shows profiles and bisectors at the original hyper-high spectral resolution, marked as dotted gray and solid gray curves.
Current usage metrics show cumulative count of Article Views (full-text article views including HTML views, PDF and ePub downloads, according to the available data) and Abstracts Views on Vision4Press platform.
Data correspond to usage on the plateform after 2015. The current usage metrics is available 48-96 hours after online publication and is updated daily on week days.
Initial download of the metrics may take a while.