Fig. 5.
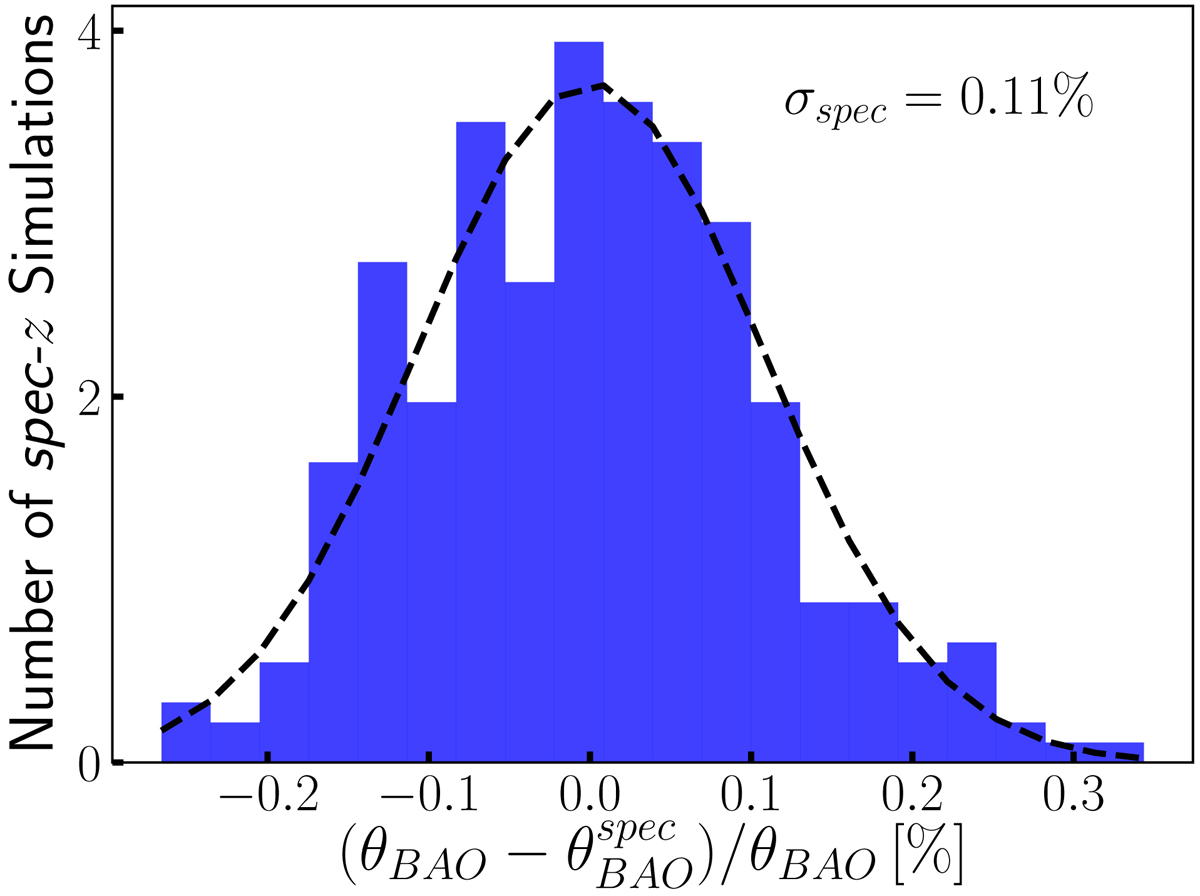
Histogram of the relative difference, in percentage (%), between the BAO scale obtained from the blue galaxy data, θBAO, and those obtained from each simulated spec-z catalog, ![]() . As expected, for the spectroscopic data the z errors affect the measurements of the BAO signature little. They contribute to the final error with only 0.11%.
. As expected, for the spectroscopic data the z errors affect the measurements of the BAO signature little. They contribute to the final error with only 0.11%.
Current usage metrics show cumulative count of Article Views (full-text article views including HTML views, PDF and ePub downloads, according to the available data) and Abstracts Views on Vision4Press platform.
Data correspond to usage on the plateform after 2015. The current usage metrics is available 48-96 hours after online publication and is updated daily on week days.
Initial download of the metrics may take a while.