Free Access
Fig. 4.
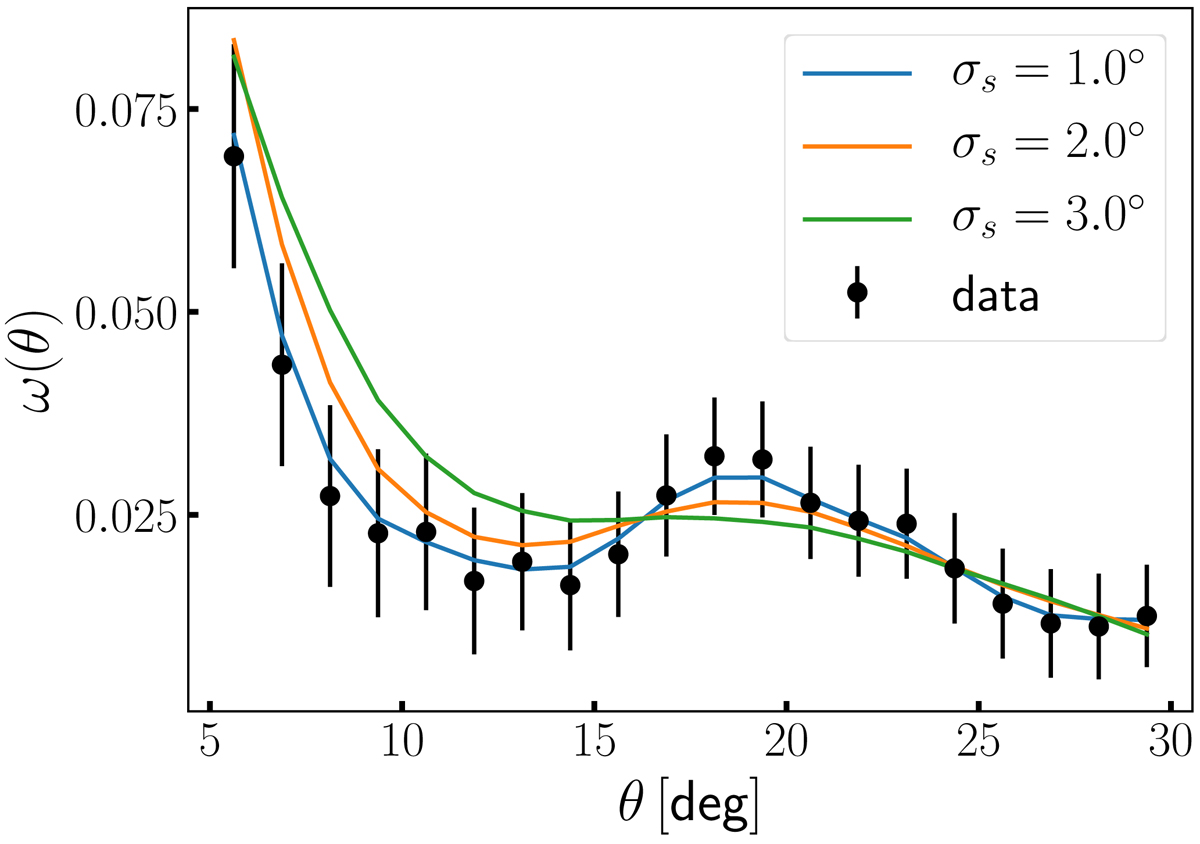
Robustness test analyses. We performed small random shifts in the galaxies angular coordinates and repeated the 2PACF calculation. The black dots represent the original data analysis, and the curves correspond to the cases we studied (as indicated in the legend).
Current usage metrics show cumulative count of Article Views (full-text article views including HTML views, PDF and ePub downloads, according to the available data) and Abstracts Views on Vision4Press platform.
Data correspond to usage on the plateform after 2015. The current usage metrics is available 48-96 hours after online publication and is updated daily on week days.
Initial download of the metrics may take a while.