Free Access
Fig. 6.
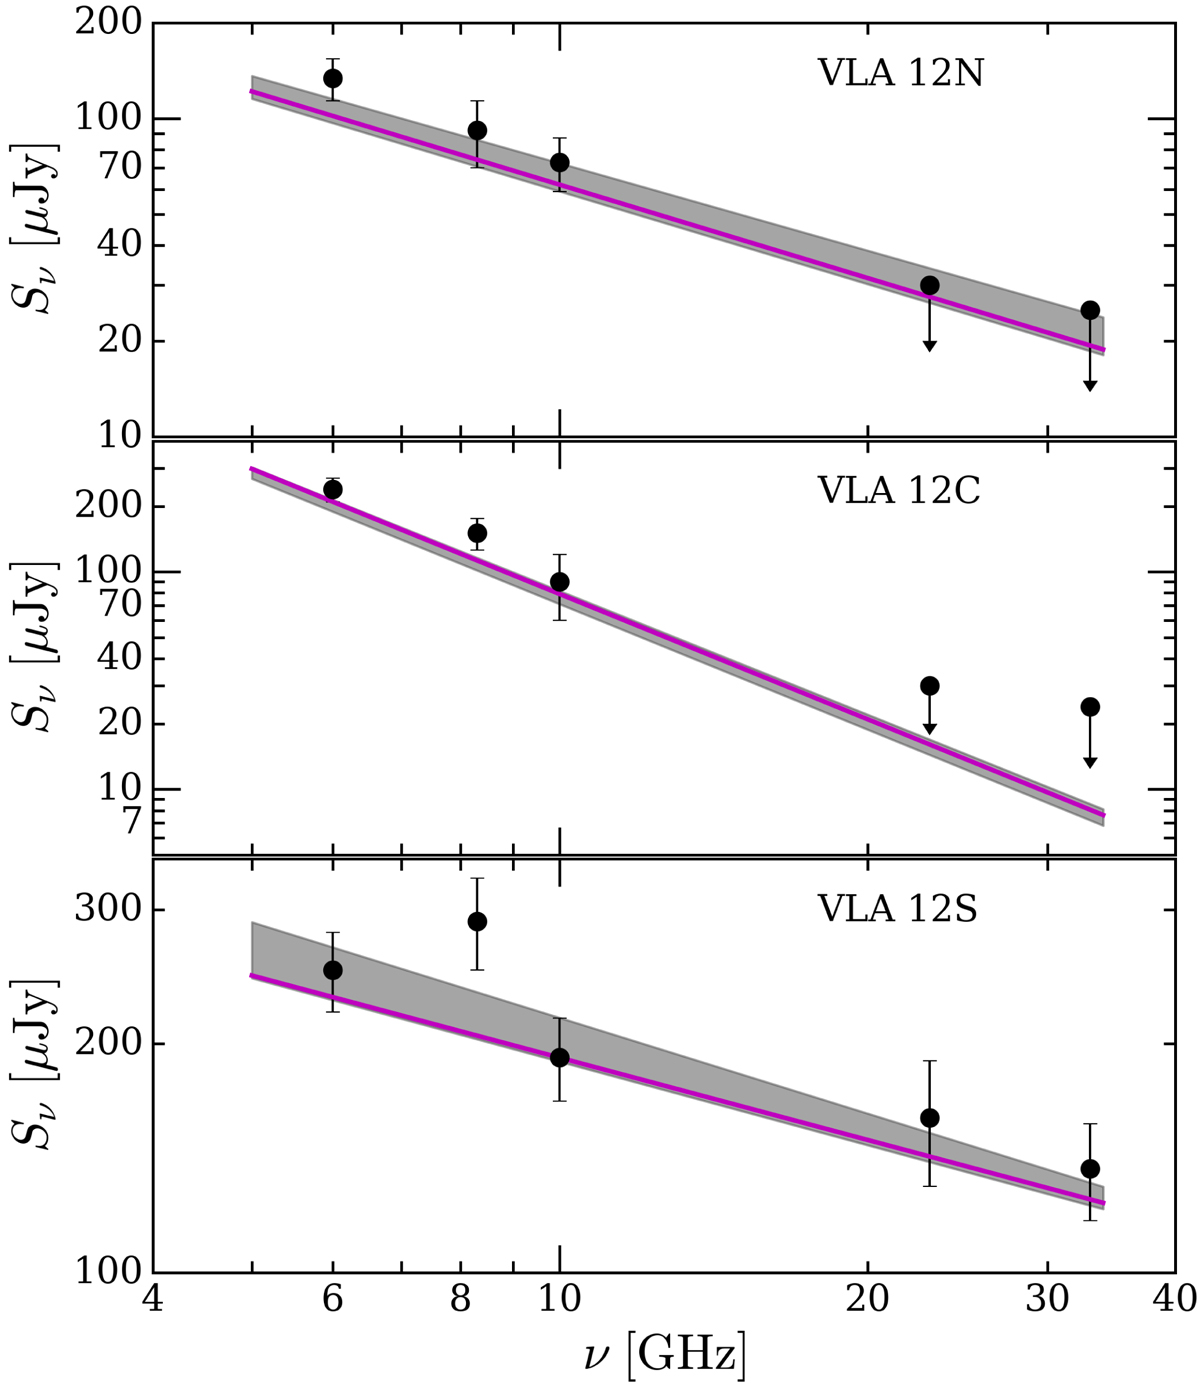
Comparison between the observed flux densities (solid black circles; Osorio et al. 2017; Tobin et al. 2019) and the best-fit models (solid magenta lines) for the three knots, VLA 12N, 12C, and 12S. The grey shaded areas encompass the models within a confidence interval between 50% (second quartile) and 96% (2σ).
Current usage metrics show cumulative count of Article Views (full-text article views including HTML views, PDF and ePub downloads, according to the available data) and Abstracts Views on Vision4Press platform.
Data correspond to usage on the plateform after 2015. The current usage metrics is available 48-96 hours after online publication and is updated daily on week days.
Initial download of the metrics may take a while.