Fig. 5.
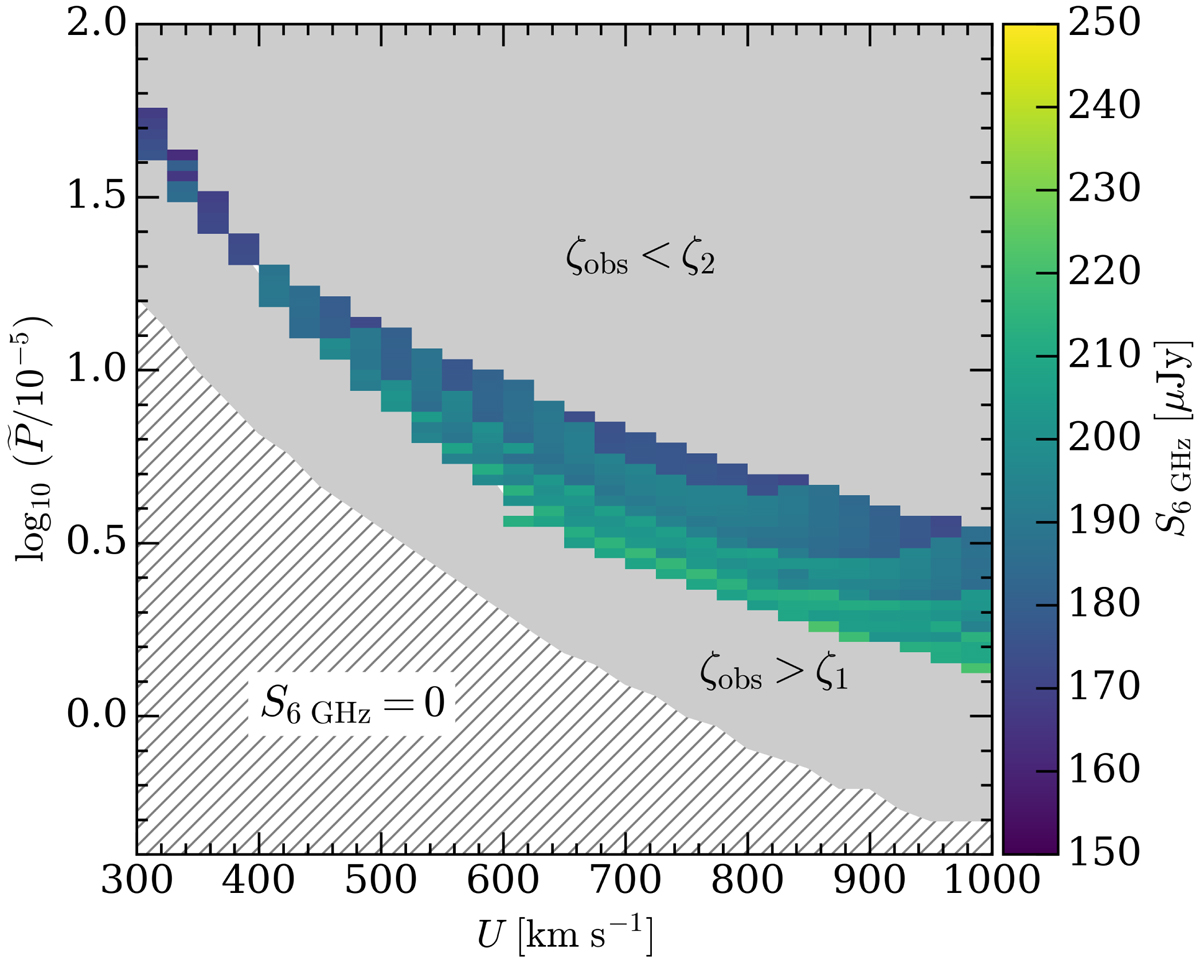
Flux density at 6 GHz obtained with the best-fit procedure for VLA 12C plotted in the space ![]() . The hatched area shows where the expected synchrotron emission is null since the acceleration process is inefficient, while the two grey areas show the regions where the constraint given by the ionisation rate estimated by observations, ζobs, is not satisfied, namely ζobs ∉ [ζ2, ζ1].
. The hatched area shows where the expected synchrotron emission is null since the acceleration process is inefficient, while the two grey areas show the regions where the constraint given by the ionisation rate estimated by observations, ζobs, is not satisfied, namely ζobs ∉ [ζ2, ζ1].
Current usage metrics show cumulative count of Article Views (full-text article views including HTML views, PDF and ePub downloads, according to the available data) and Abstracts Views on Vision4Press platform.
Data correspond to usage on the plateform after 2015. The current usage metrics is available 48-96 hours after online publication and is updated daily on week days.
Initial download of the metrics may take a while.