Fig. 2.
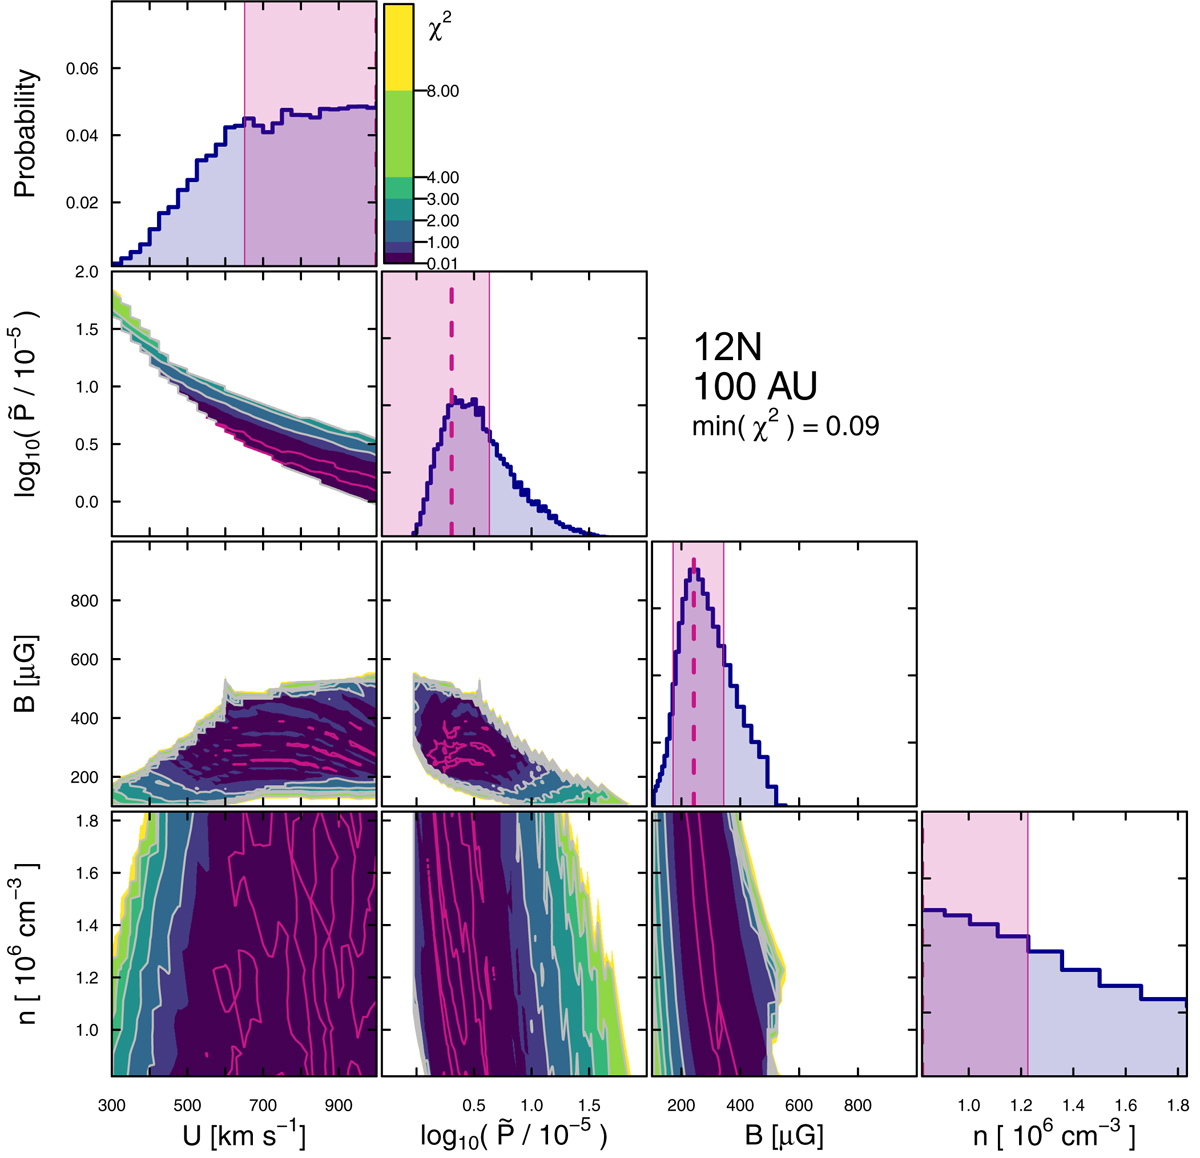
Corner plot of the χ2 surface as a function of the model parameters for VLA 12N. The region size has been fixed externally for these fits. We show an individual corner plot for ℓ⊥ = 100 AU, the best-fit source size. The violet contours correspond to the minimum χ2 value. Top panels in each column: probability density distributions for the marginalised parameters; confidence intervals (±1σ) are shown as violet shaded rectangular regions, and the maximum-likelihood estimate is shown by a vertical dashed line. These values together with the upper and lower uncertainties inferred from the confidence intervals are also reported.
Current usage metrics show cumulative count of Article Views (full-text article views including HTML views, PDF and ePub downloads, according to the available data) and Abstracts Views on Vision4Press platform.
Data correspond to usage on the plateform after 2015. The current usage metrics is available 48-96 hours after online publication and is updated daily on week days.
Initial download of the metrics may take a while.