Fig. 1.
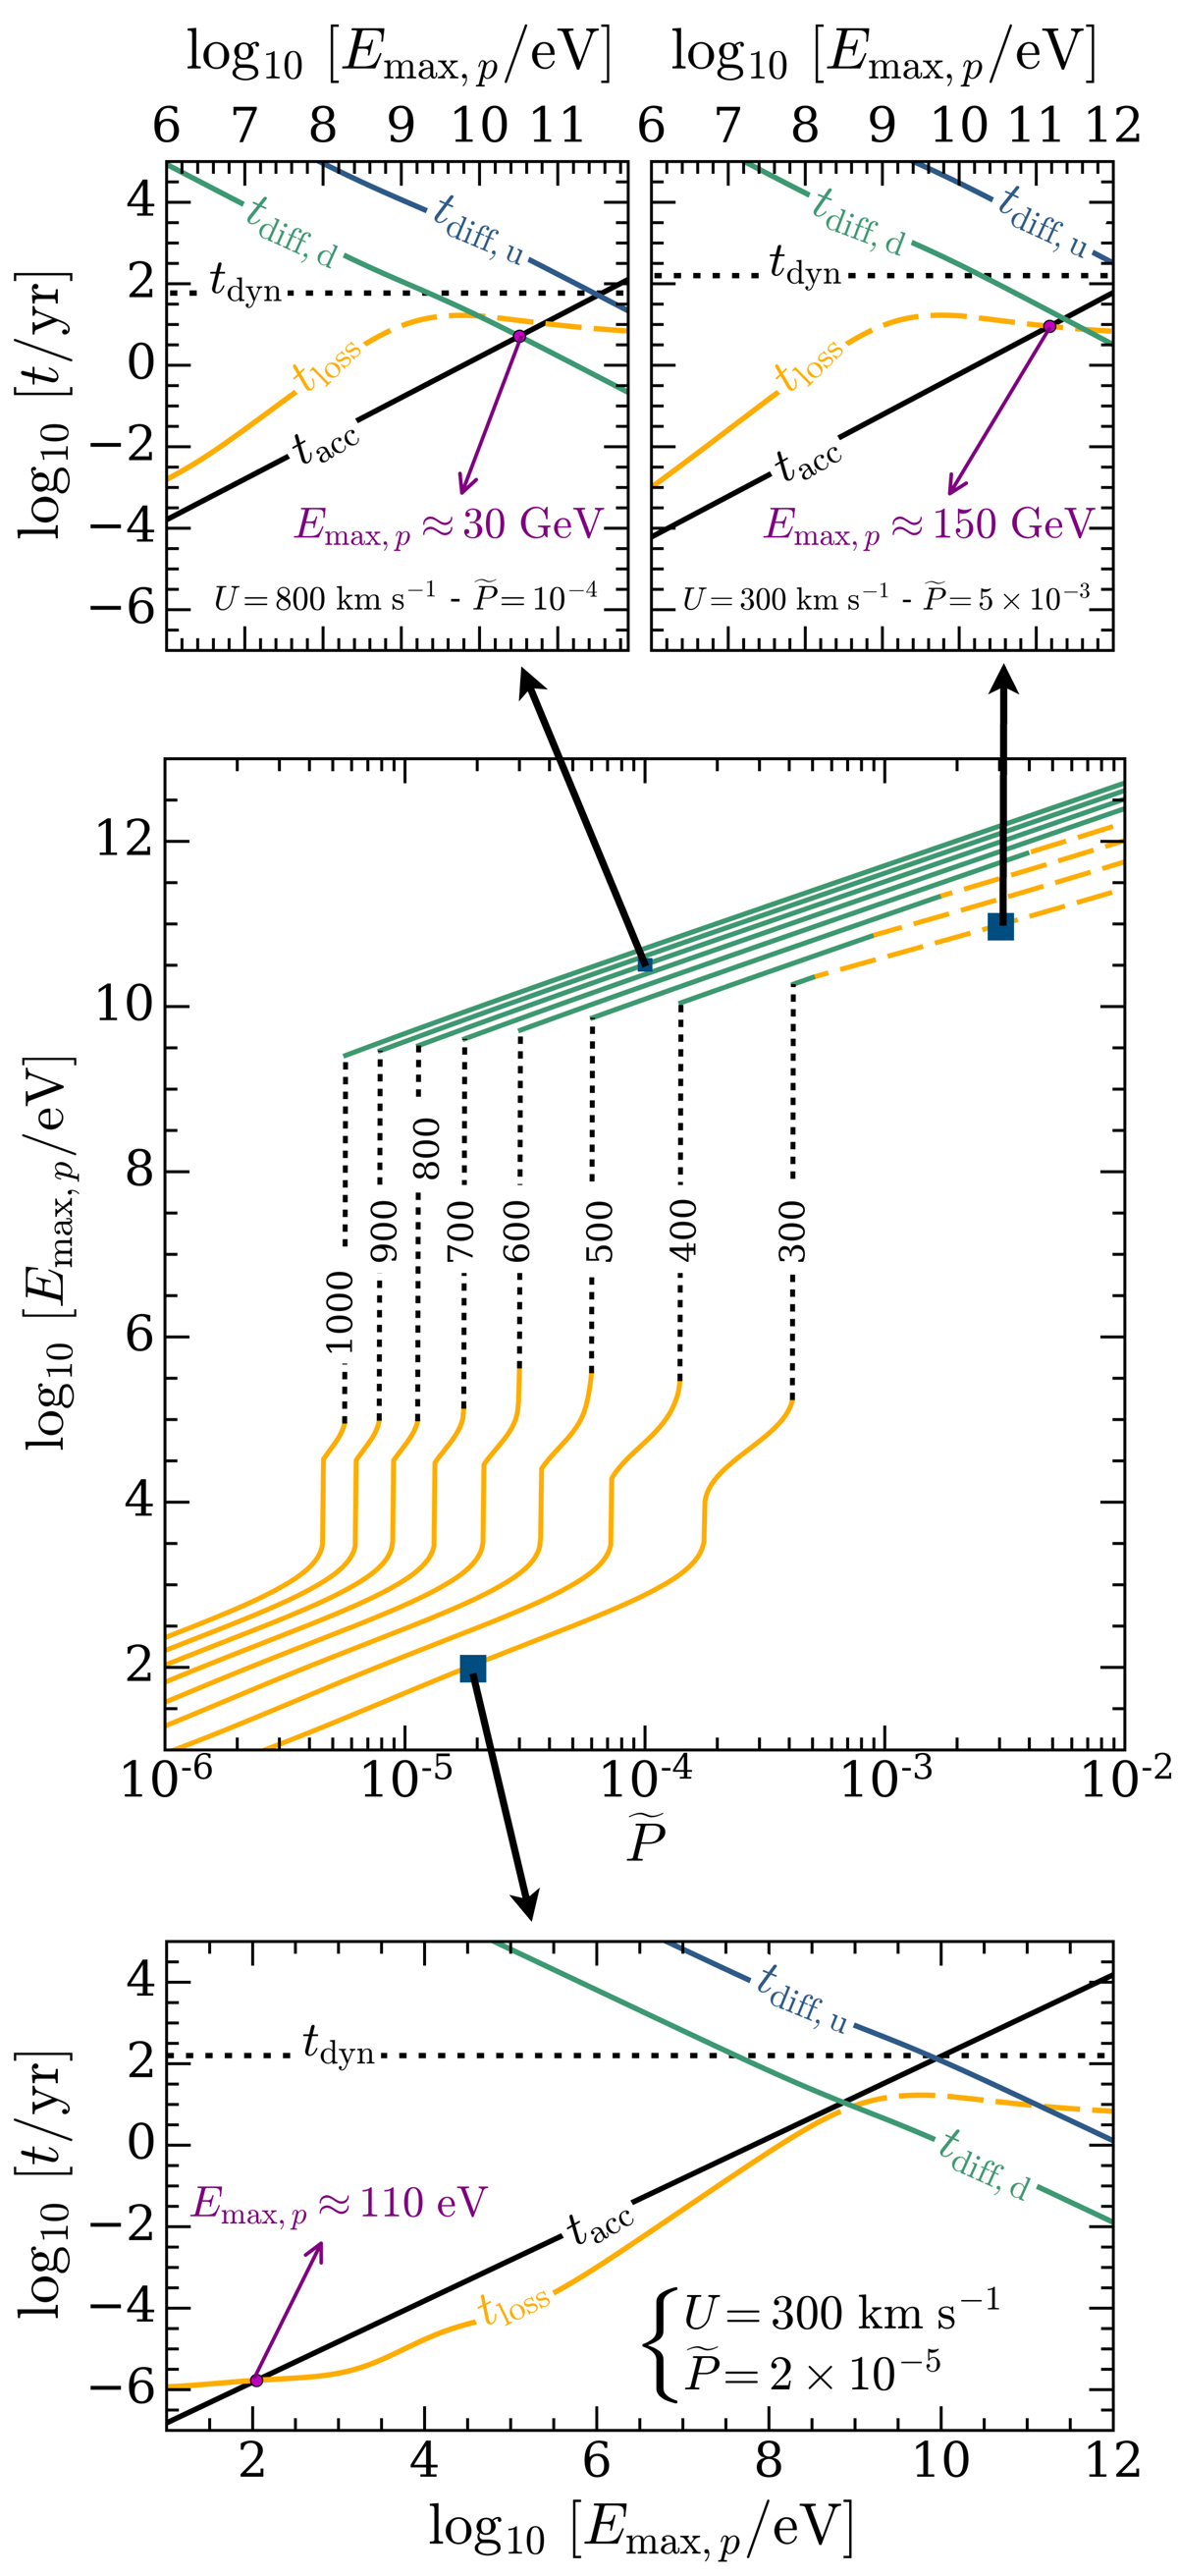
Comparison of timescales and determination of the maximum energy of protons, Emax, p. Central panel: Emax, p versus the shock-accelerated particle pressure, P̃, normalised to the ram pressure for different jet velocities, U, in units of km s−1 (black labels). Solid and dashed orange lines show values of Emax, p constrained by the Coulomb and pion losses, respectively. Solid green lines show Emax, p constrained by the downstream diffusion timescale. Upper and lower panels: timescales involved in the calculation of Emax, p (Eqs. (3)–(7)) for three sets of U and P̃; B = 100 μG, n = 106 cm−3, ℓ⊥ = 400 AU, and R = 12 612 AU.
Current usage metrics show cumulative count of Article Views (full-text article views including HTML views, PDF and ePub downloads, according to the available data) and Abstracts Views on Vision4Press platform.
Data correspond to usage on the plateform after 2015. The current usage metrics is available 48-96 hours after online publication and is updated daily on week days.
Initial download of the metrics may take a while.