Fig. 8
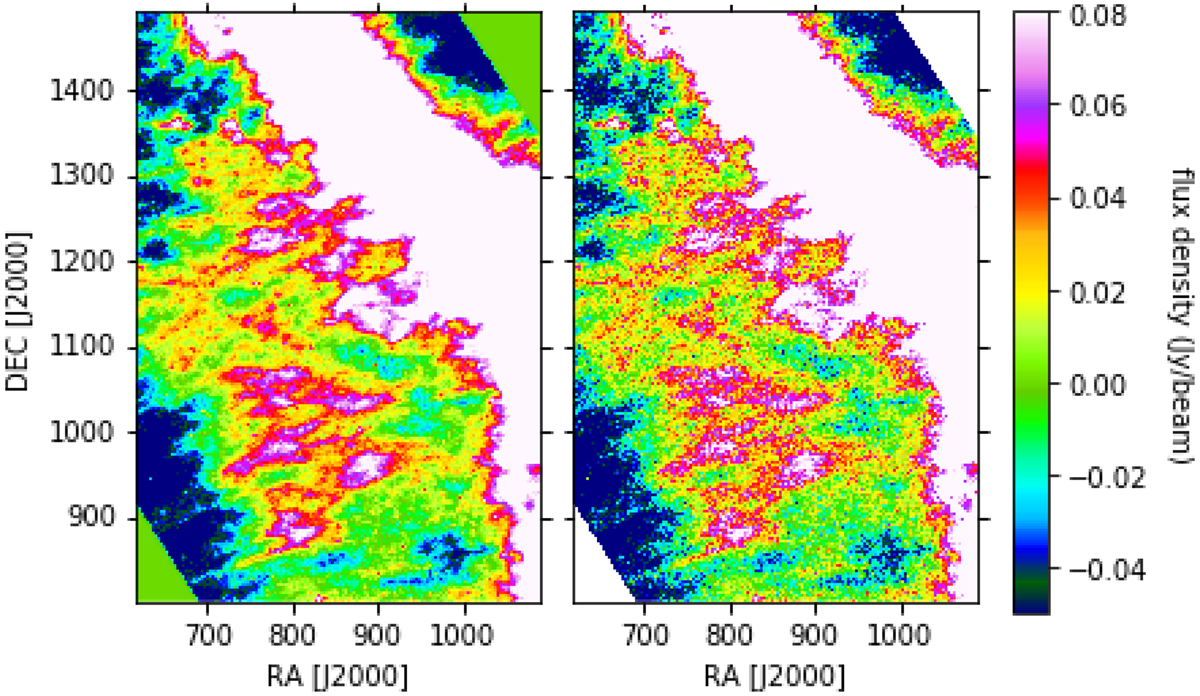
Visualization of the filtering (computed with λ = 0.7) zoomed in on the central part of the Musca 250 μm map. The level was chosen to emphasize low values. The left panel shows the filtered data and the right the unfiltered data. The positive effect of the filtering on the flux density data becomes obvious. The visualization performed on the singularity exponents (see Fig. 9) demonstrates the importance of filtering on filamentary structures, which are oflow fractal dimensions.
Current usage metrics show cumulative count of Article Views (full-text article views including HTML views, PDF and ePub downloads, according to the available data) and Abstracts Views on Vision4Press platform.
Data correspond to usage on the plateform after 2015. The current usage metrics is available 48-96 hours after online publication and is updated daily on week days.
Initial download of the metrics may take a while.