Open Access
Fig. 7
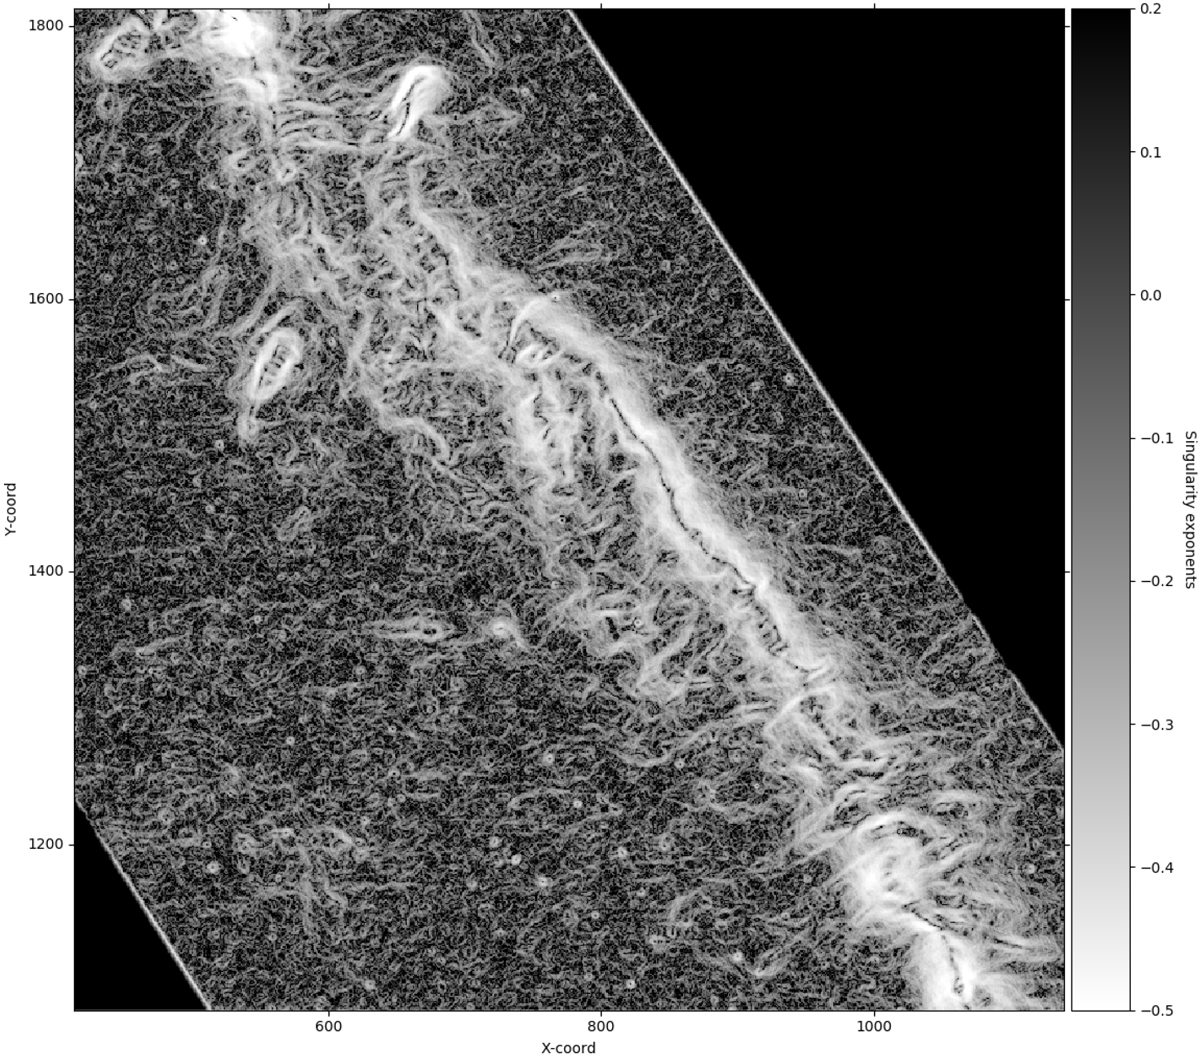
Map of the singularity exponents computed on filtered Musca 250 μm data. The image is a magnification of the singularity map over the central part of the Musca observation map to better show how the singularity exponents reflect the complex distribution of filamentary coherent structures.
Current usage metrics show cumulative count of Article Views (full-text article views including HTML views, PDF and ePub downloads, according to the available data) and Abstracts Views on Vision4Press platform.
Data correspond to usage on the plateform after 2015. The current usage metrics is available 48-96 hours after online publication and is updated daily on week days.
Initial download of the metrics may take a while.