Fig. 5
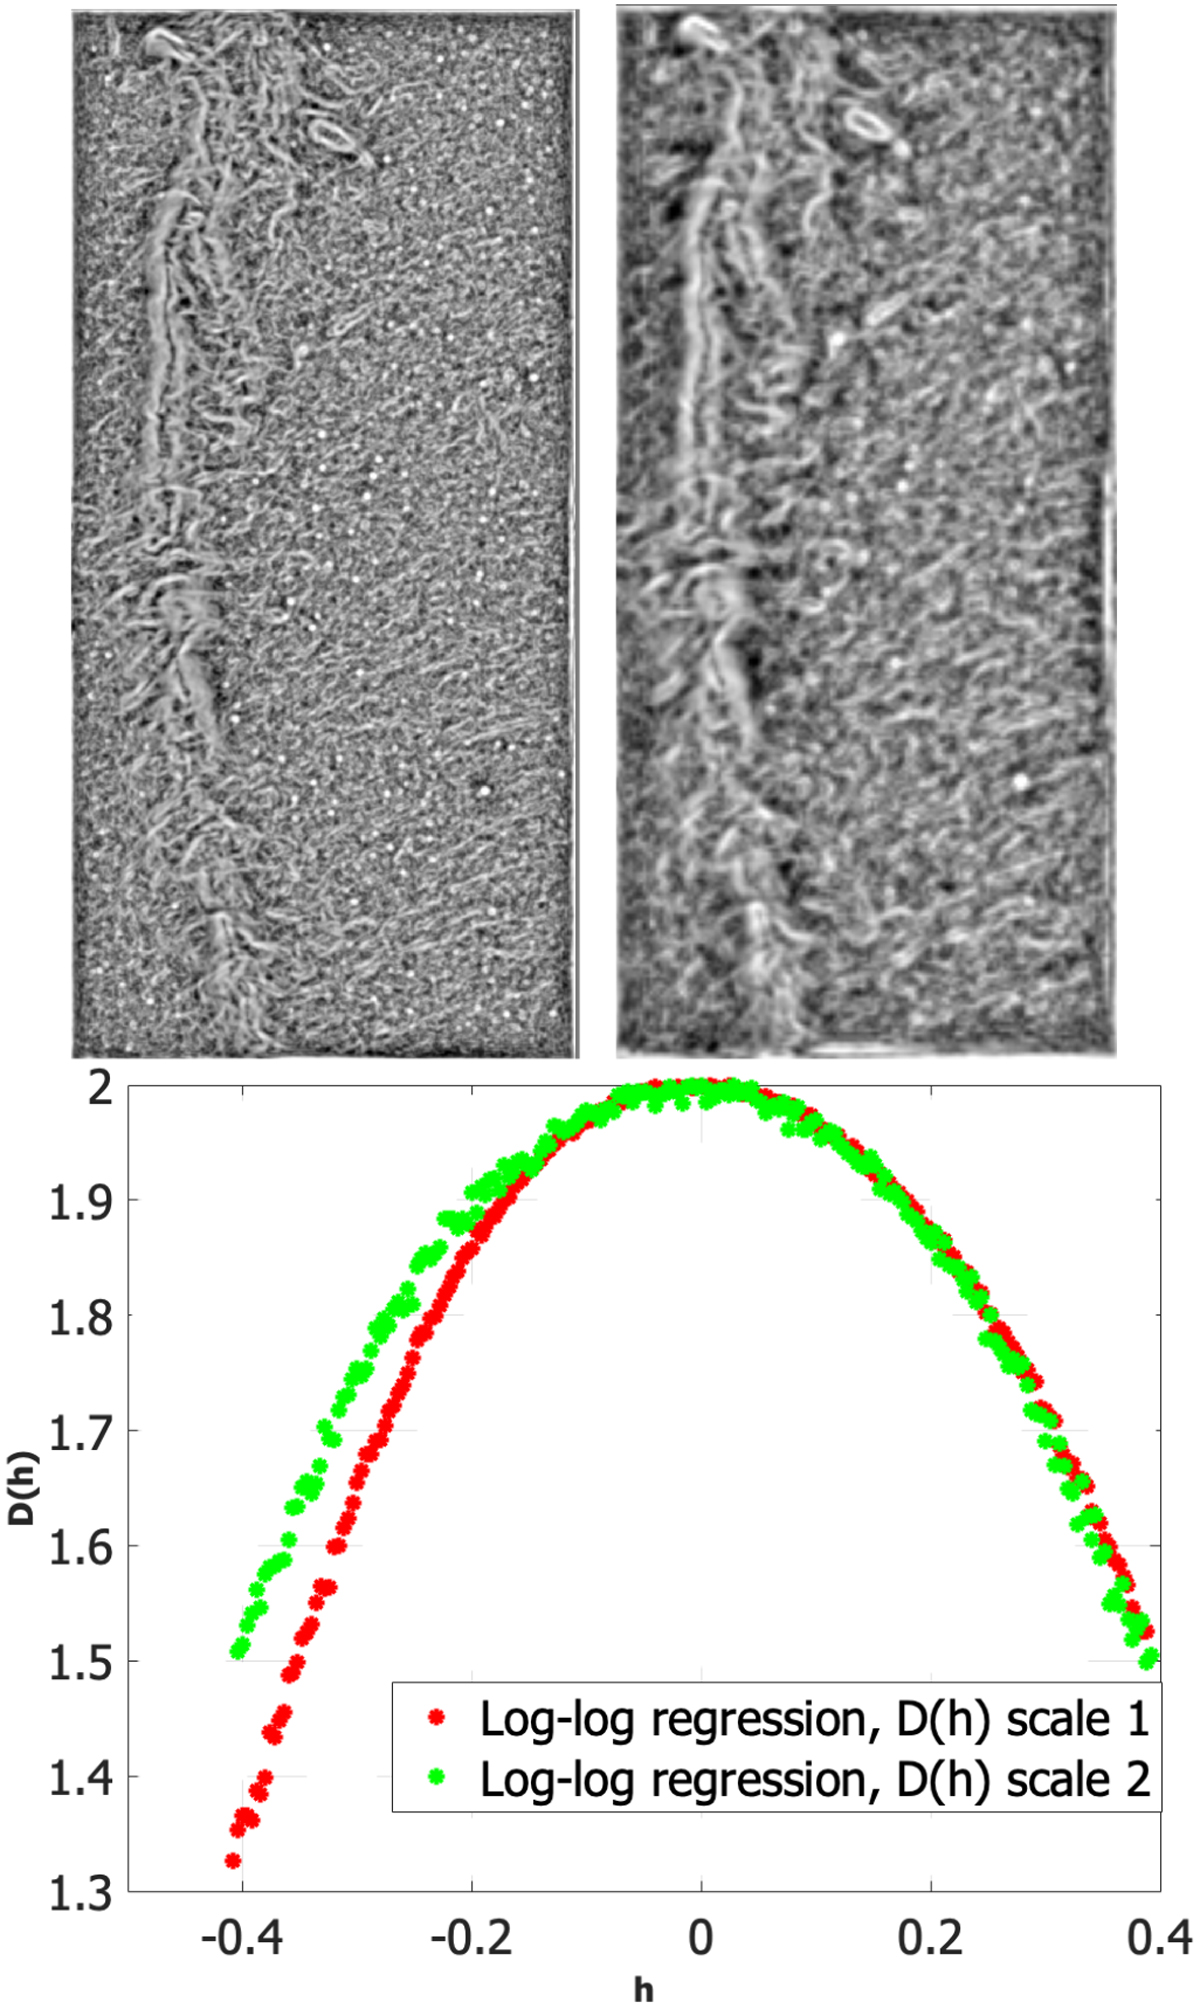
Checking scale invariance: gradient modulus wavelet projection method, log-regression. Top row: visualization of the singularity exponents computed through log-regression using a Lorentz wavelet of order 3 on the Musca 250 μm Herschel flux map presented in Sect. 2. The singularity exponents are computed with the gradient modulus wavelet projection method algorithm. The two upper images correspond to two consecutive downscaled wavelet projections of the original signal using a discrete wavelet projection. Bottom: resulting mappings h ↦ D(h) using the singularity exponents computed on the two consecutive scales (red: one-half scale of the original Musca 250 μm Herschel flux map; green: one-fourth scale of the original Musca 250 μm Herschel flux map). Inside the domain corresponding to h ≤ 0 the two mappings do not coincide. Consequently, the log-regression method for computing the singularity exponents provide poor result in this case.
Current usage metrics show cumulative count of Article Views (full-text article views including HTML views, PDF and ePub downloads, according to the available data) and Abstracts Views on Vision4Press platform.
Data correspond to usage on the plateform after 2015. The current usage metrics is available 48-96 hours after online publication and is updated daily on week days.
Initial download of the metrics may take a while.