Fig. 24
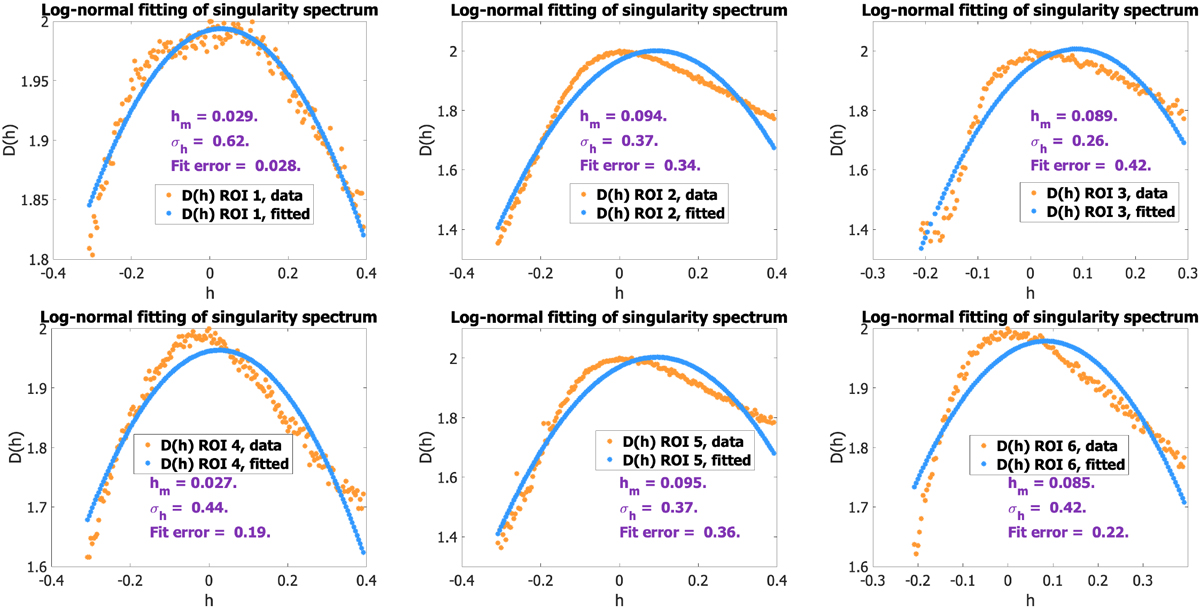
Singularity spectrum and log-normal fit for each ROI. Shown for each region of interest in the Musca cloud delimited in Fig. 22 are the singularity spectrum h↦D(h) of an ROI (in orange), a log-normal fitted approximation singularity spectrum (in blue; Eq. (9)), the obtained numerical values hm and σh, and the error of the fit. The various values of hm and σh for each ROI are also given in Table 1.
Current usage metrics show cumulative count of Article Views (full-text article views including HTML views, PDF and ePub downloads, according to the available data) and Abstracts Views on Vision4Press platform.
Data correspond to usage on the plateform after 2015. The current usage metrics is available 48-96 hours after online publication and is updated daily on week days.
Initial download of the metrics may take a while.