Open Access
Fig. 20
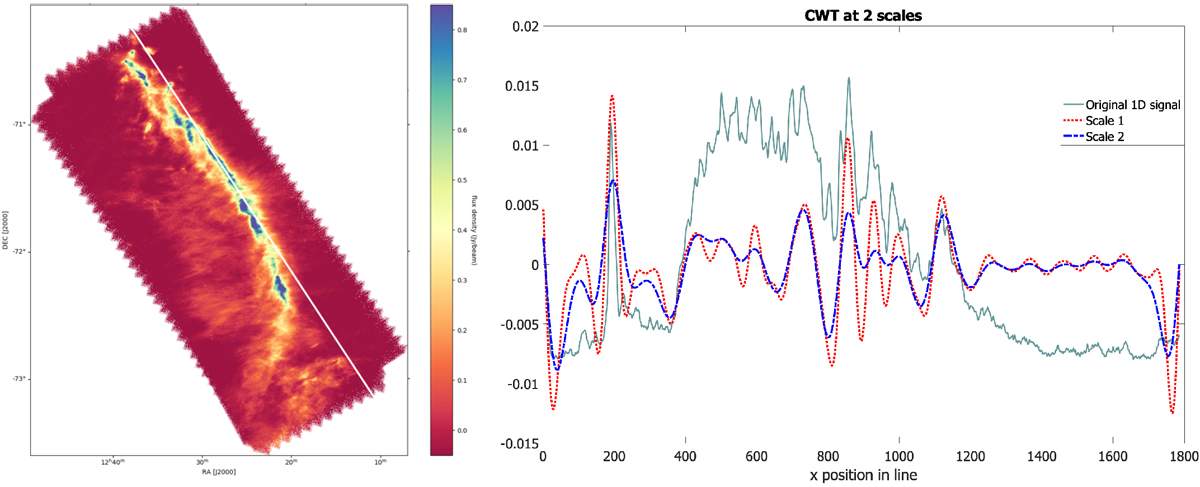
CWT analysis performed on a 1D signal extracted from the Musca 250 μm map. Left panel: Musca 250 μm map in which the white column defines a 1D signal. Right panel: original 1D signal (centered and rescaled) and CWT projections of the selected 1D signal with the Mexican hat wavelet at scales 5 (red) and 60 (blue).
Current usage metrics show cumulative count of Article Views (full-text article views including HTML views, PDF and ePub downloads, according to the available data) and Abstracts Views on Vision4Press platform.
Data correspond to usage on the plateform after 2015. The current usage metrics is available 48-96 hours after online publication and is updated daily on week days.
Initial download of the metrics may take a while.