Fig. 18
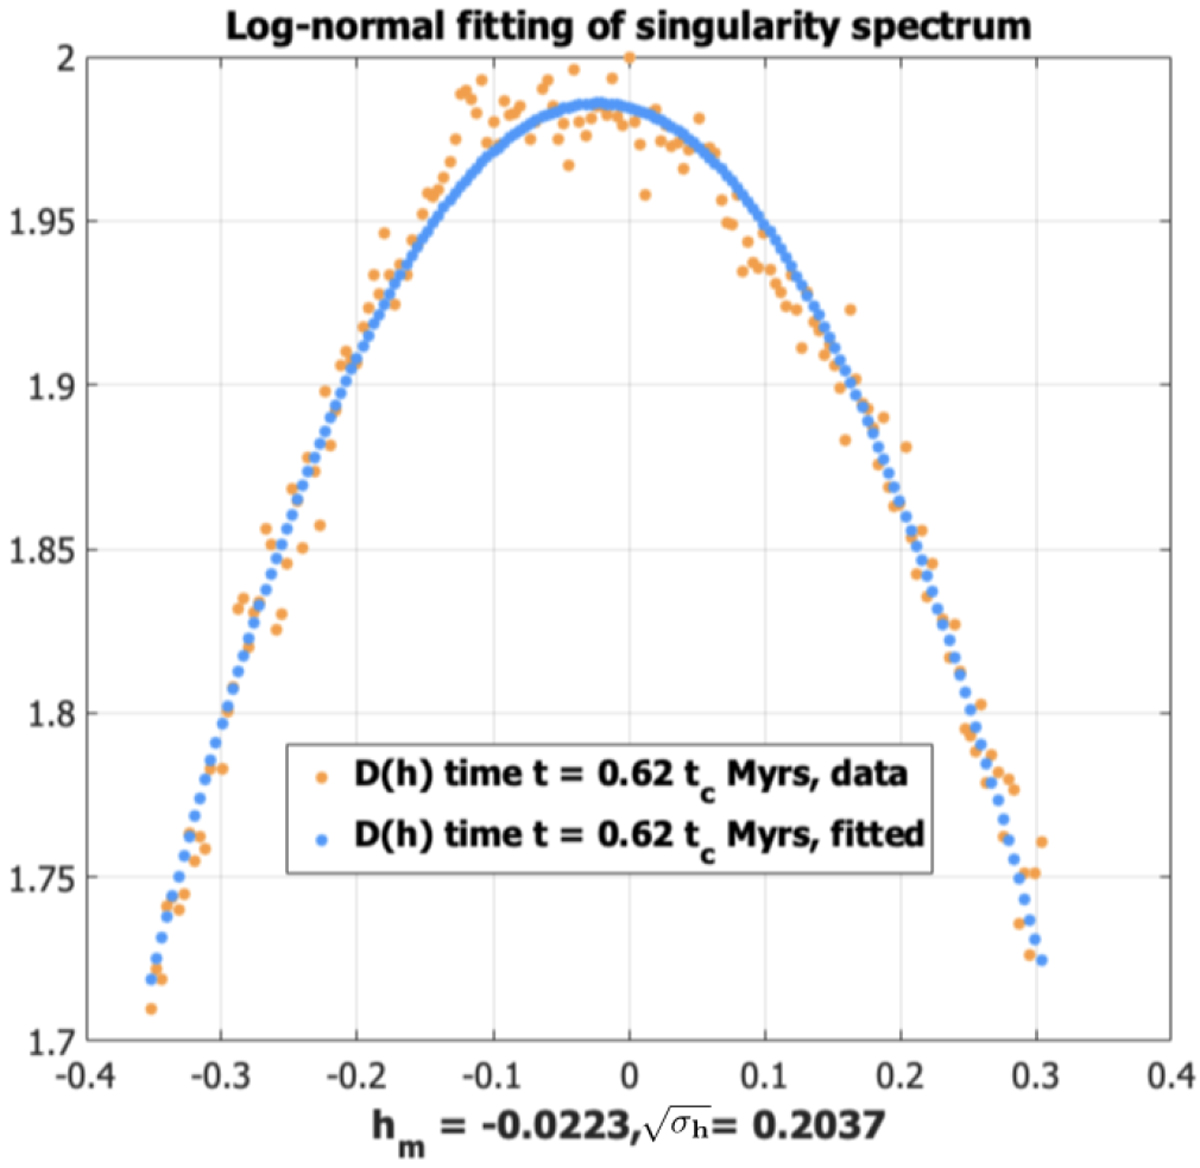
Log-normal fit of the singularity spectrum for the data corresponding to time t = 0.62tc Myr after gravityis turned on. Shown is the singularity spectrum computed in the microcanonical framework (orange) and a fitted quadratic log-normal singularity spectrum (blue). The fit is very good, which indicates a good approximation by a log -normal process.
Current usage metrics show cumulative count of Article Views (full-text article views including HTML views, PDF and ePub downloads, according to the available data) and Abstracts Views on Vision4Press platform.
Data correspond to usage on the plateform after 2015. The current usage metrics is available 48-96 hours after online publication and is updated daily on week days.
Initial download of the metrics may take a while.