Fig. 17
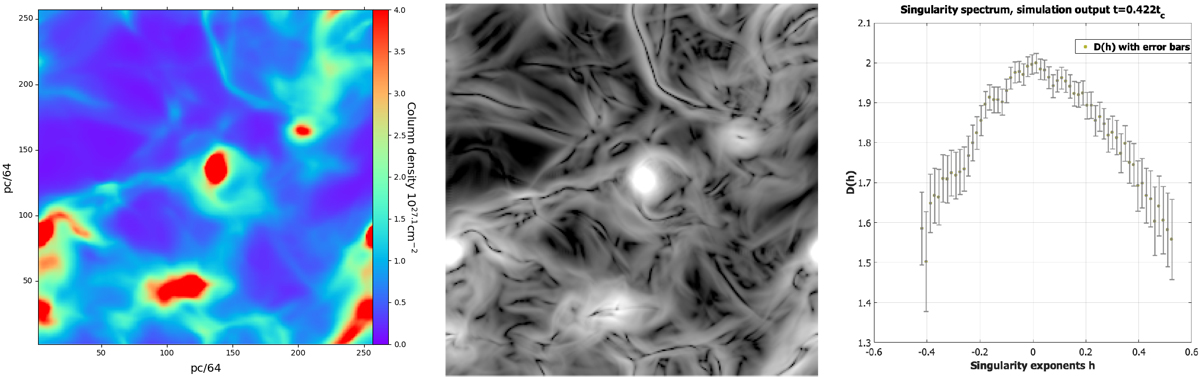
Multifractal analysis of MHD data. Left panel: one snapshot of the column density output of the MHD simulation data used in this work, integrated along one axis of the cube. The output shown here corresponds to the hydrodynamical case with no magnetic field at time t = 0.422 tc. Middle panel: map of the singularity exponents. Right panel: singularity spectrum with its error bars computed using Eq. (24).
Current usage metrics show cumulative count of Article Views (full-text article views including HTML views, PDF and ePub downloads, according to the available data) and Abstracts Views on Vision4Press platform.
Data correspond to usage on the plateform after 2015. The current usage metrics is available 48-96 hours after online publication and is updated daily on week days.
Initial download of the metrics may take a while.