Fig. 15
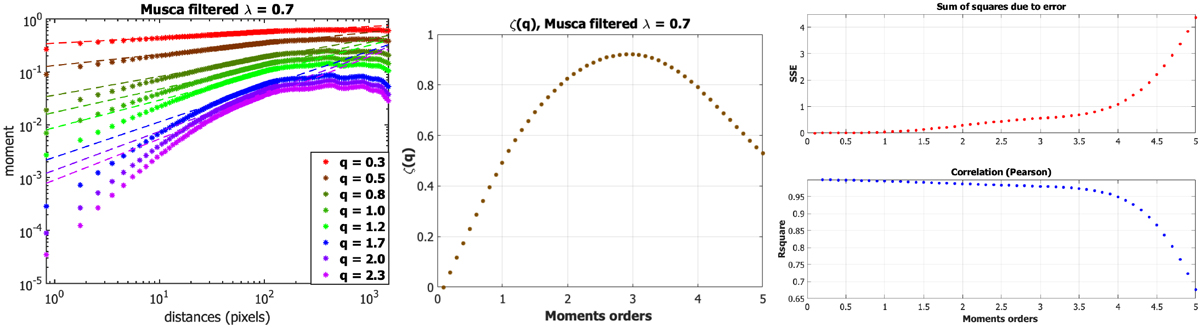
Result of the 2D structure function method for the determination of an inertial range of spatial scales. Computations are done on the Musca 250 μm map filtered data with λ = 0.7 (Eq. (22)). A total of 5 × 10⁸ couples of points (x1, x2) are chosen uniformly in the spatial domain; moments q are between 0.1 and 5, with increment steps of 0.1 (for clarity, only some of the moments are shown). The left panel shows the graph of a log −log plot (Eq. (25)), with colors indicating some moment values, q. The image also shows the graphs of linear regression fits (dotted lines), performed in an inertial range covering the interval [13, 160] pixels, corresponding to the range of distance [0.053, 0.65] pc. The middle panel displays the resulting map q↦ζ(q). The two panels on the right show the quality of the linear regression: the sse and the r correlation coefficient. Hence, the quality of the fit decreases with the moment order q.
Current usage metrics show cumulative count of Article Views (full-text article views including HTML views, PDF and ePub downloads, according to the available data) and Abstracts Views on Vision4Press platform.
Data correspond to usage on the plateform after 2015. The current usage metrics is available 48-96 hours after online publication and is updated daily on week days.
Initial download of the metrics may take a while.