Fig. 6.
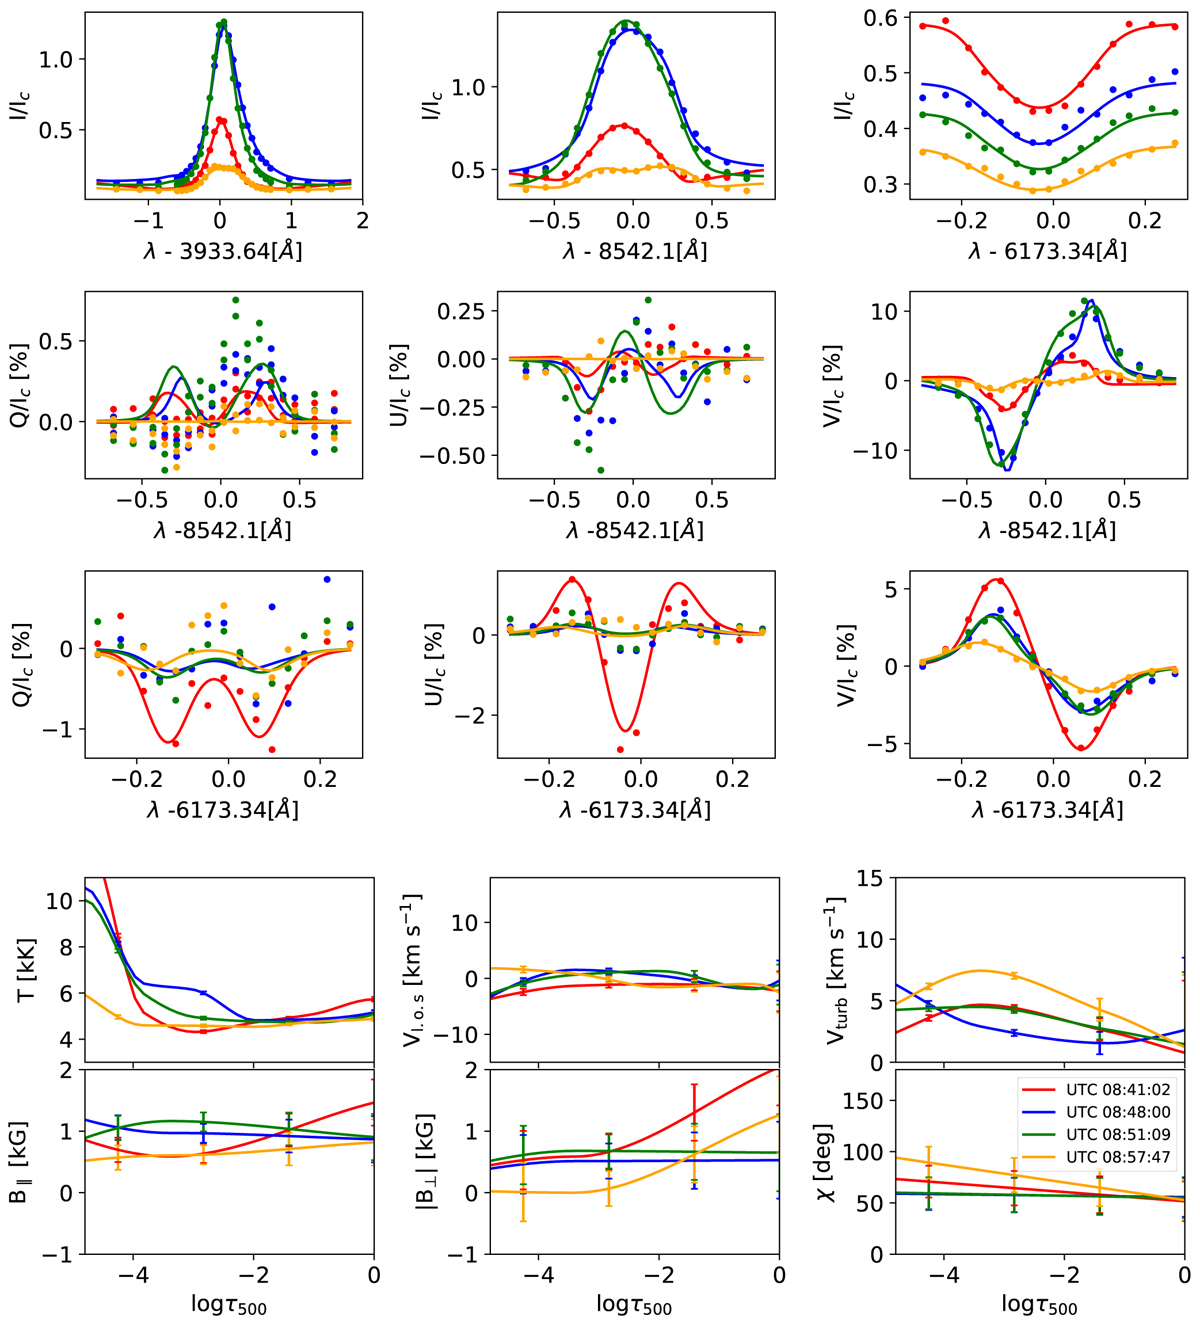
Fitting of observed profiles and retrieved physical parameters. Top three rows: observed (dotted lines) and best fits (solid lines) of the Stokes profiles. Bottom two rows: inferred model atmosphere retrieved from the inversion with the STiC code. Different colors indicate the time of the observations during a flare. The observed profiles are located at the P3 indicated in Fig. 2. The vertical bars refer to the uncertainties in the inferred parameters at different node locations.
Current usage metrics show cumulative count of Article Views (full-text article views including HTML views, PDF and ePub downloads, according to the available data) and Abstracts Views on Vision4Press platform.
Data correspond to usage on the plateform after 2015. The current usage metrics is available 48-96 hours after online publication and is updated daily on week days.
Initial download of the metrics may take a while.