Fig. 5.
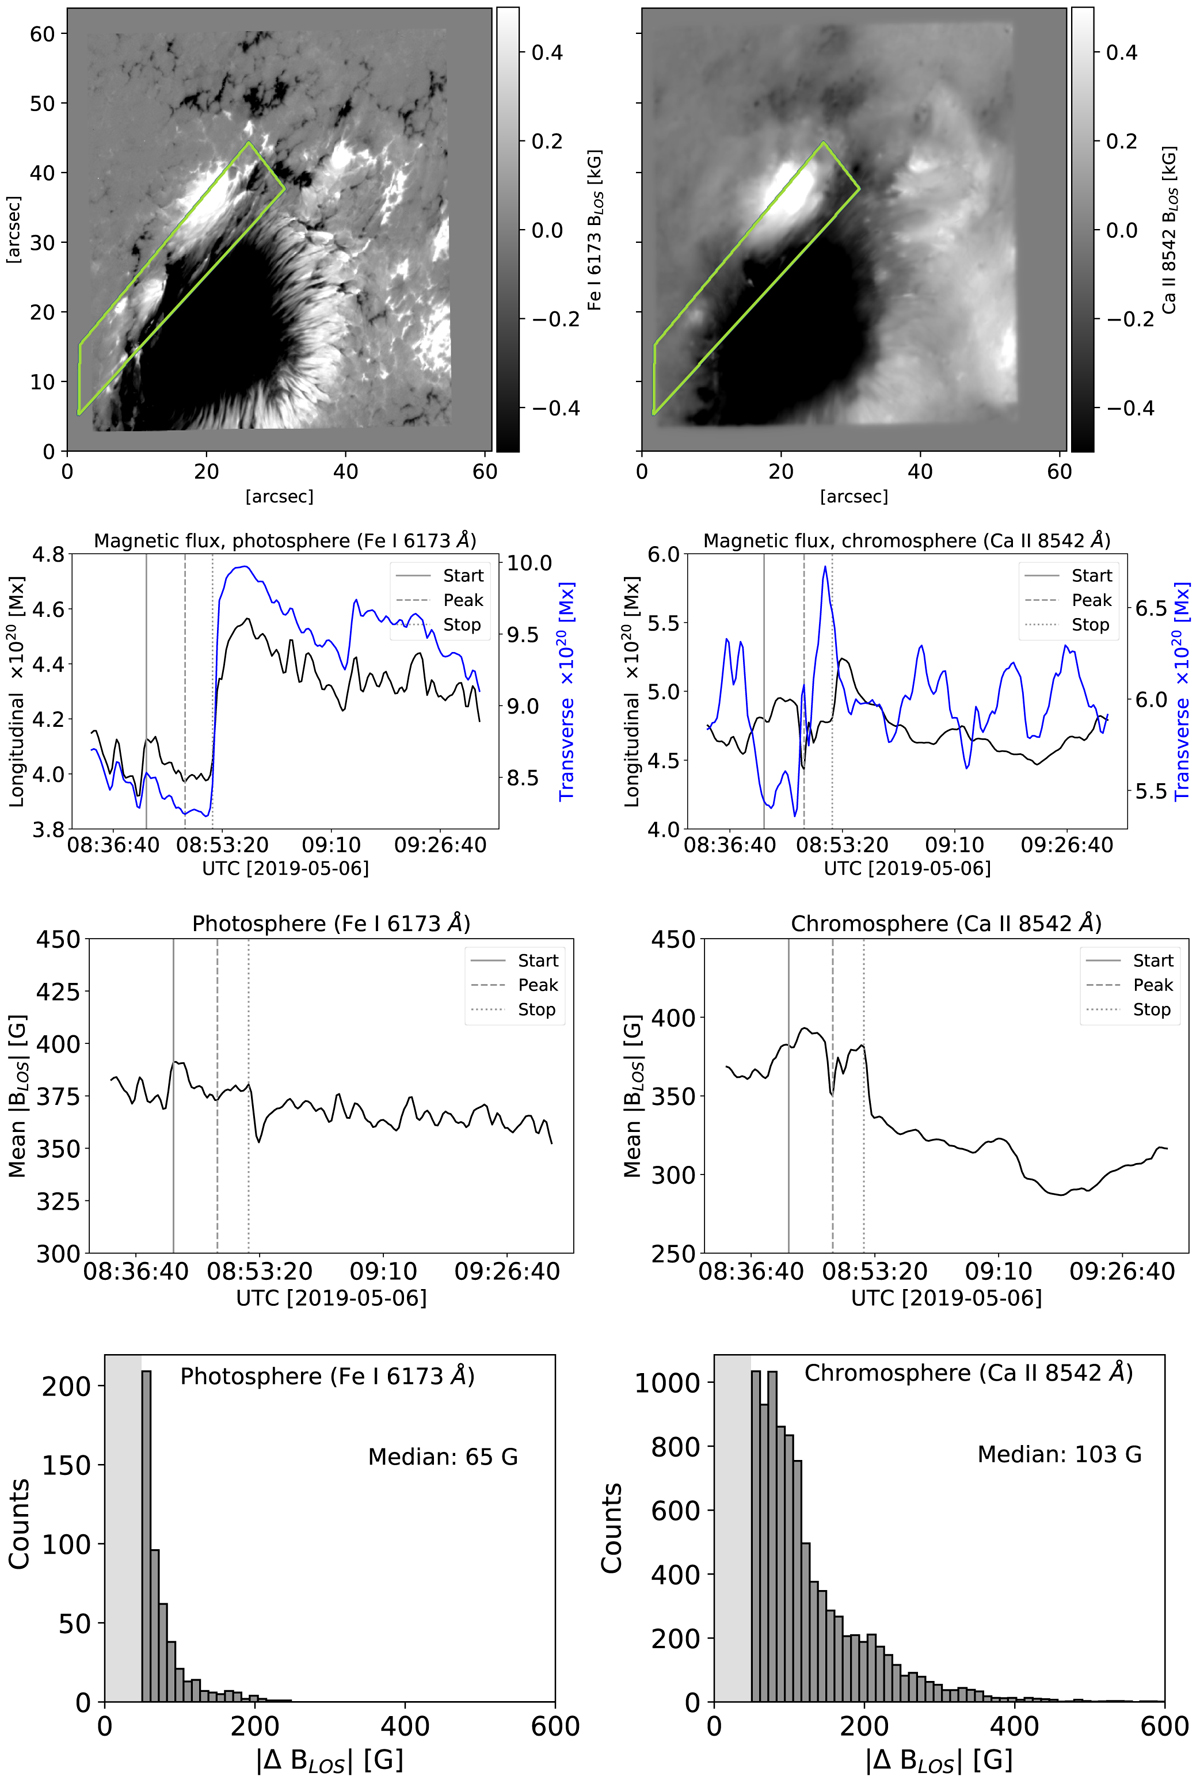
Retrieved magnetic field in the photosphere (left column) and chromosphere (right column) during the flare. Top row: photospheric magnetogram retrieved from a Milne-Eddington inversion of the Fe I line (left), and chromospheric magnetogram obtained from the WFA for the Ca II 8542 Å line around the flare peak time (08:46 UT; right). Second row: temporal evolution of the mean longitudinal and transverse magnetic flux in the green box. Third row: mean LOS magnetic field evaluated for the pixels located in the green box. Bottom row: histograms of the LOS magnetic field change (> 50 G) observed in the photosphere and the chromosphere at the flare peak time.
Current usage metrics show cumulative count of Article Views (full-text article views including HTML views, PDF and ePub downloads, according to the available data) and Abstracts Views on Vision4Press platform.
Data correspond to usage on the plateform after 2015. The current usage metrics is available 48-96 hours after online publication and is updated daily on week days.
Initial download of the metrics may take a while.