Free Access
Fig. 3.
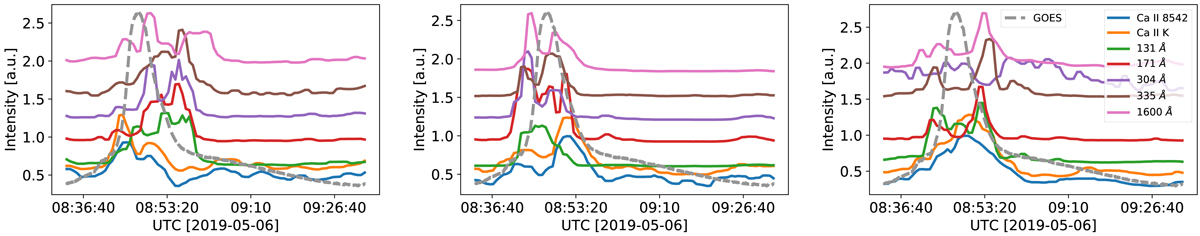
Temporal evolution of intensity observed with the AIA channels and the Ca II K and Ca II 8542 Å lines for the pixels located at the points P1, P2, and P3 shown in Fig. 2. The dashed gray lines refer to the GOES X-ray curve. The profiles are arbitrarily shifted along the y-axis.
Current usage metrics show cumulative count of Article Views (full-text article views including HTML views, PDF and ePub downloads, according to the available data) and Abstracts Views on Vision4Press platform.
Data correspond to usage on the plateform after 2015. The current usage metrics is available 48-96 hours after online publication and is updated daily on week days.
Initial download of the metrics may take a while.