Fig. 2.
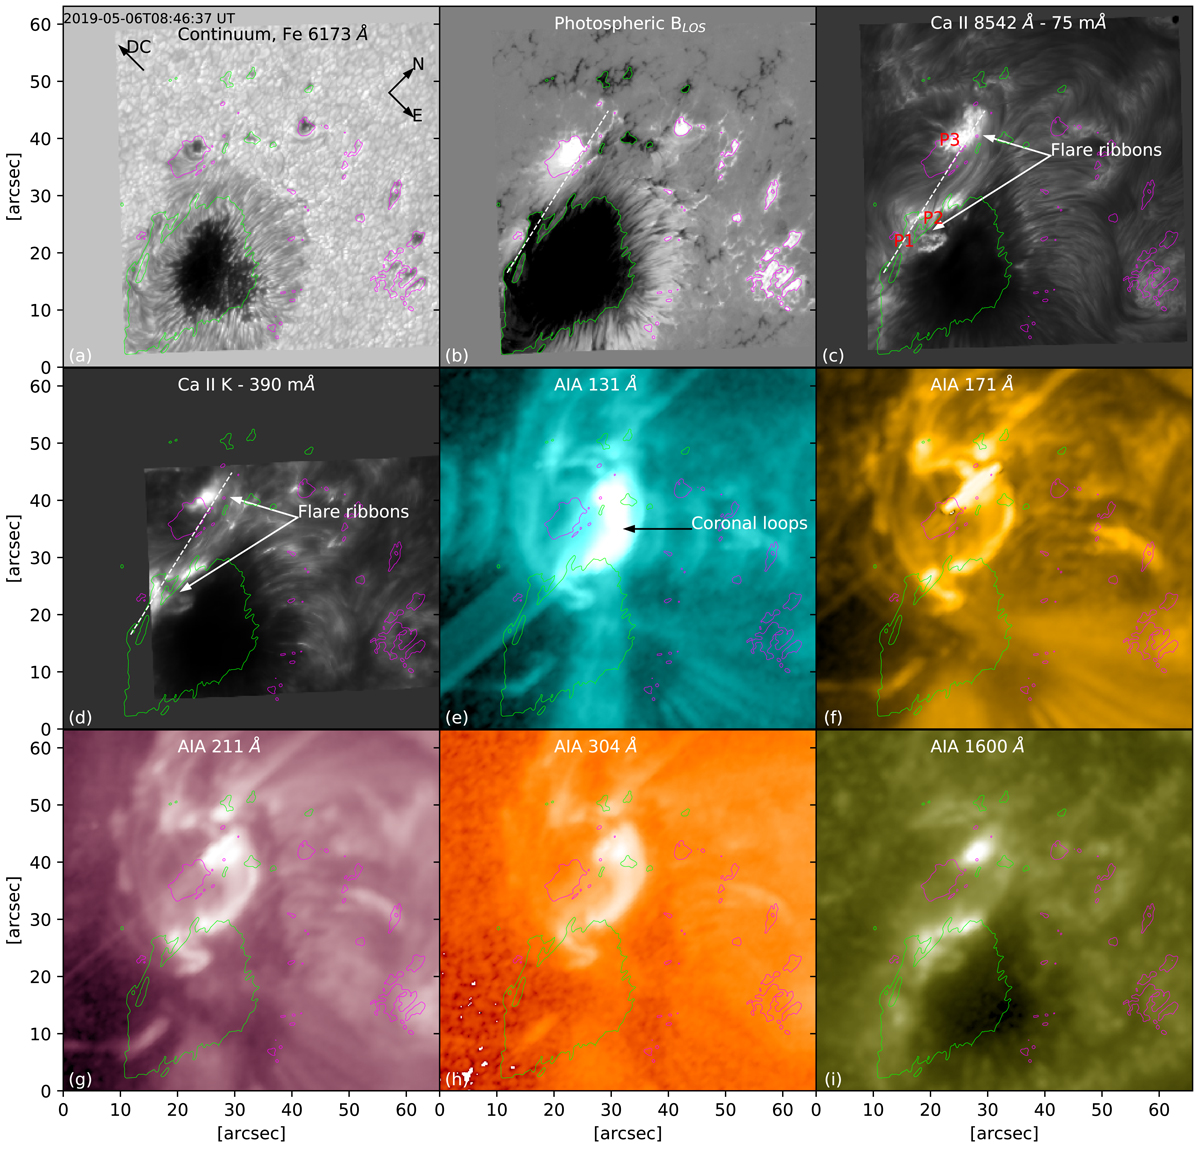
Overview of the C2-class flare observed at 08:46 UT on May 6, 2019. Panel a: continuum map showing the sunspot and the pores. Panel b: line-of-sight magnetic field as inferred from a Milne-Eddington inversion of the Fe I 6173.34 Å line. The color scale extends in the ±0.8 kG range, where black and white represent the negative and positive polarity, respectively. Panels c and d: chromospheric intensity maps, observed with the CRISP and CHROMIS instruments at the SST, showing bright flare ribbons at the flare footpoints. Panels e–i: AIA images observed in different channels, in logarithmic scale. The green and magenta contours represent the negative and positive polarity in the photosphere, respectively. A dashed white line and the “P1”, “P2”, and “P3” in panel c highlight the location of the pixels analyzed in the paper. Solar north, solar east, and the direction of the disk center are indicated by “N”, “E”, and “DC”, respectively.
Current usage metrics show cumulative count of Article Views (full-text article views including HTML views, PDF and ePub downloads, according to the available data) and Abstracts Views on Vision4Press platform.
Data correspond to usage on the plateform after 2015. The current usage metrics is available 48-96 hours after online publication and is updated daily on week days.
Initial download of the metrics may take a while.