Fig. 12.
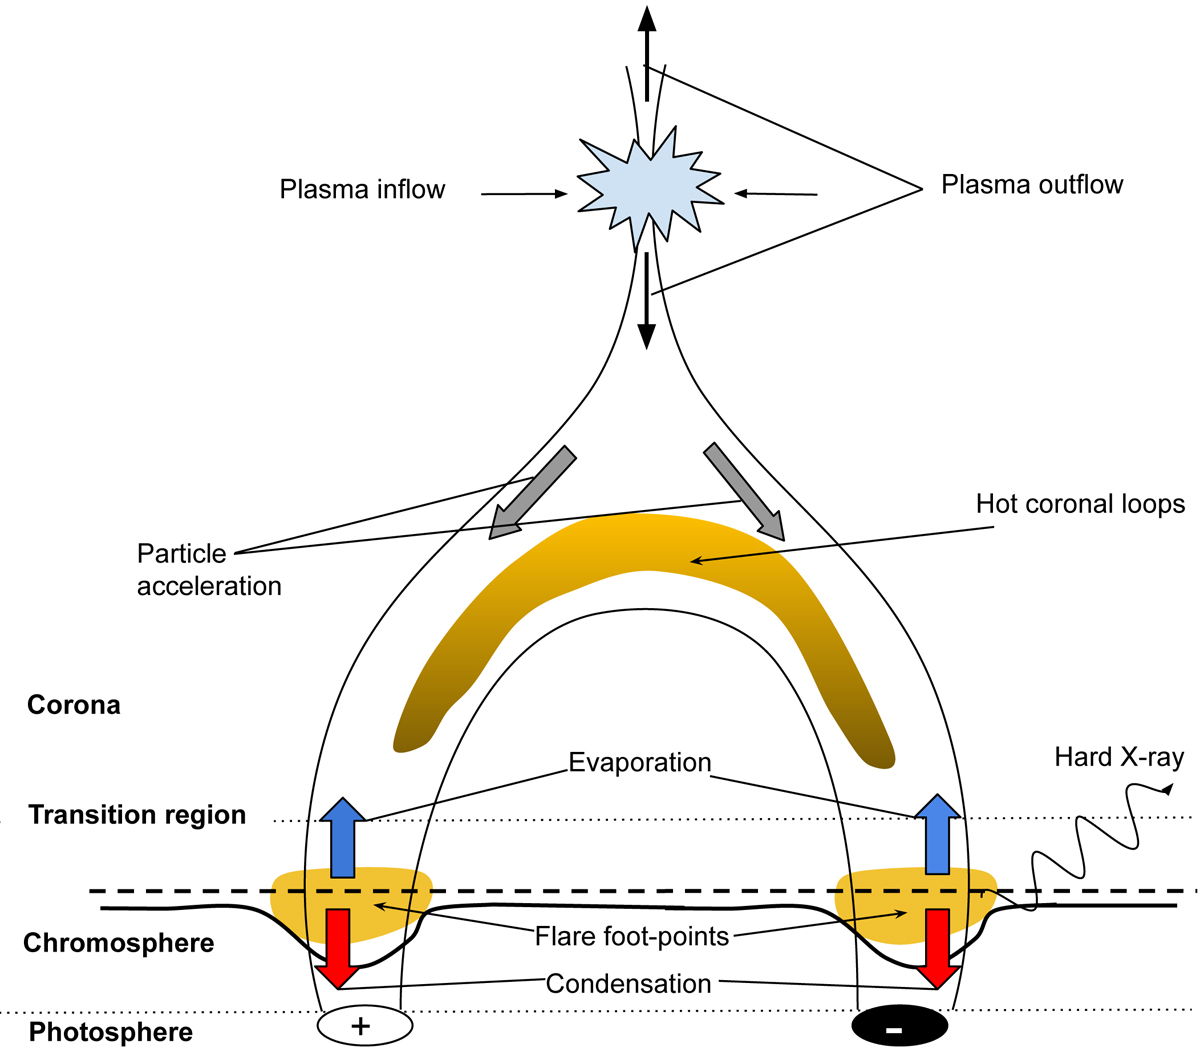
Sketch of the standard flare model. A plausible scenario in the chromosphere explaining our observations is depicted. The observed chromospheric condensation and evaporation near the flare footpoints are indicated by red and blue arrows, respectively. The dashed black line and the solid black line refer to the average RFs (around the line core) of the chromospheric lines (Ca II K and Ca II 8542 Å) to the temperature during the no-flare and flare peak times, respectively.
Current usage metrics show cumulative count of Article Views (full-text article views including HTML views, PDF and ePub downloads, according to the available data) and Abstracts Views on Vision4Press platform.
Data correspond to usage on the plateform after 2015. The current usage metrics is available 48-96 hours after online publication and is updated daily on week days.
Initial download of the metrics may take a while.