Fig. 11.
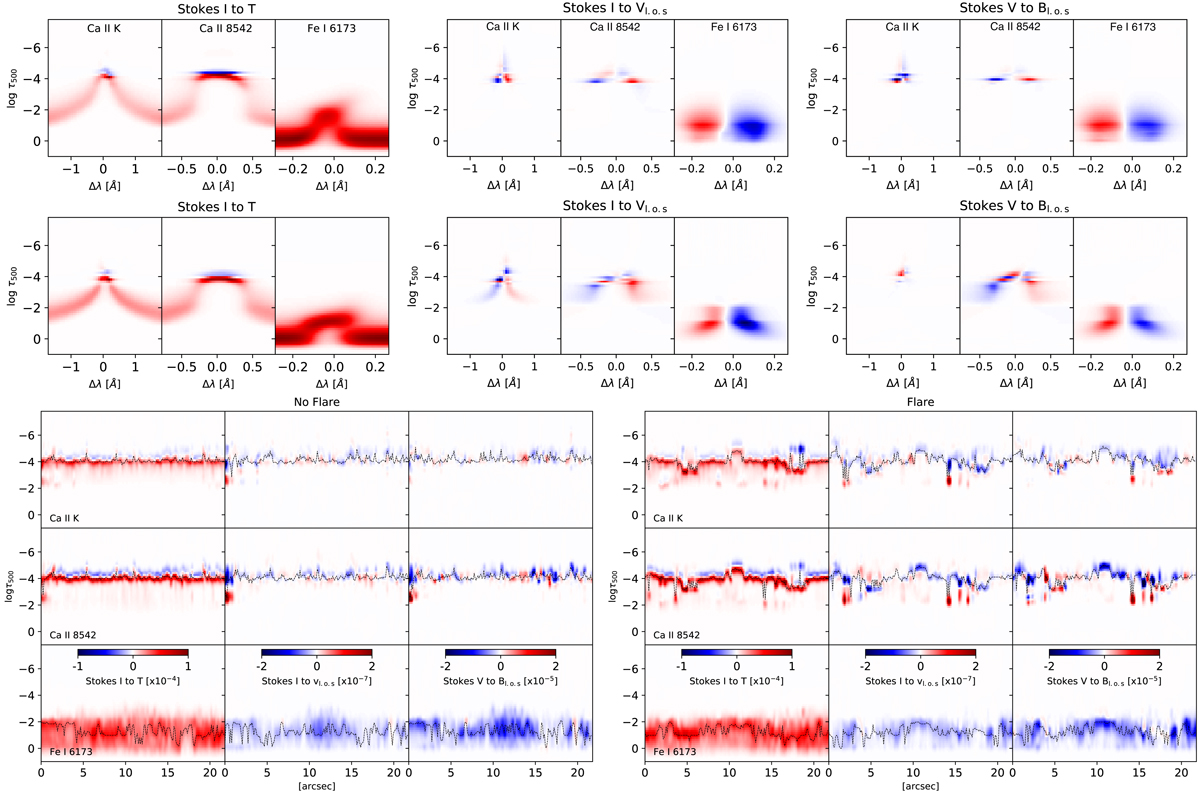
Response functions of the Stokes profiles at the flare and no-flare time. Top and middle rows: response functions of the Stokes profiles to temperature, velocity, and LOS magnetic field as a function of wavelength, obtained during the no-flare time (top panel) and the flare peak time (middle panel). Bottom panels: mean RFs around the line core for the pixels located on the dashed line at the flare time (right) and the no-flare time (left). The dotted black lines refer to the maximum RF values.
Current usage metrics show cumulative count of Article Views (full-text article views including HTML views, PDF and ePub downloads, according to the available data) and Abstracts Views on Vision4Press platform.
Data correspond to usage on the plateform after 2015. The current usage metrics is available 48-96 hours after online publication and is updated daily on week days.
Initial download of the metrics may take a while.