Fig. 10.
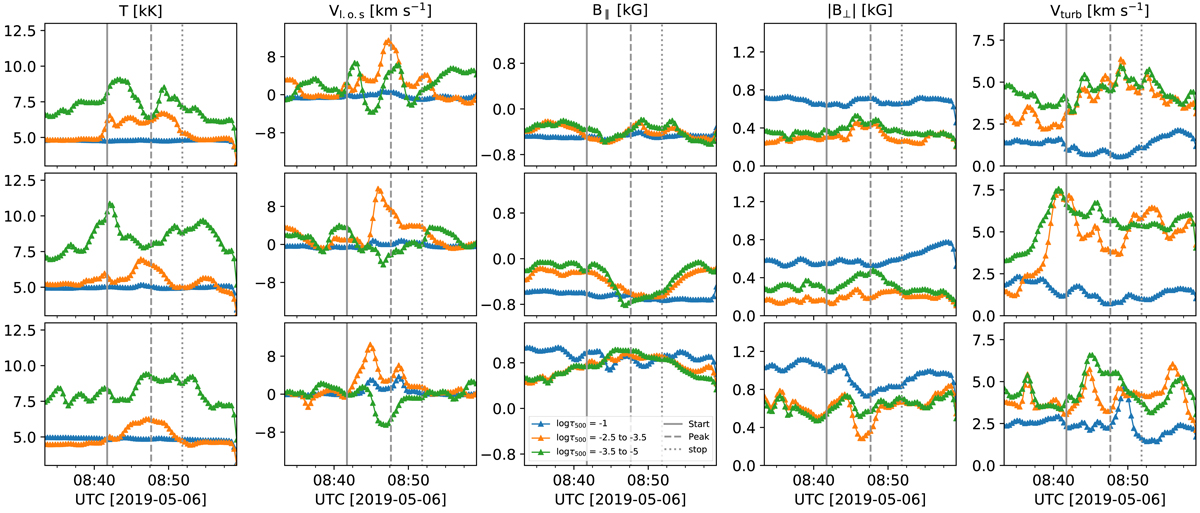
Temporal evolution of the temperature, LOS velocity, longitudinal and transverse magnetic field, and microturbulent velocity obtained from the inversion with the STiC code at the P1 (top panels), P2 (middle panels), and P3 (bottom panels) locations highlighted in Fig. 2. The blue symbols refer to the mean values evaluated at log τ500 ∼ −1. The orange and green symbols represent the mean values determined between log τ500 ∼ −2.5 and −3.5 and between log τ500 ∼ −3.5 and −5, respectively. The vertical solid, dashed, and dotted lines refer to the start, peak, and end times of the flare, respectively.
Current usage metrics show cumulative count of Article Views (full-text article views including HTML views, PDF and ePub downloads, according to the available data) and Abstracts Views on Vision4Press platform.
Data correspond to usage on the plateform after 2015. The current usage metrics is available 48-96 hours after online publication and is updated daily on week days.
Initial download of the metrics may take a while.