Free Access
Fig. 1.
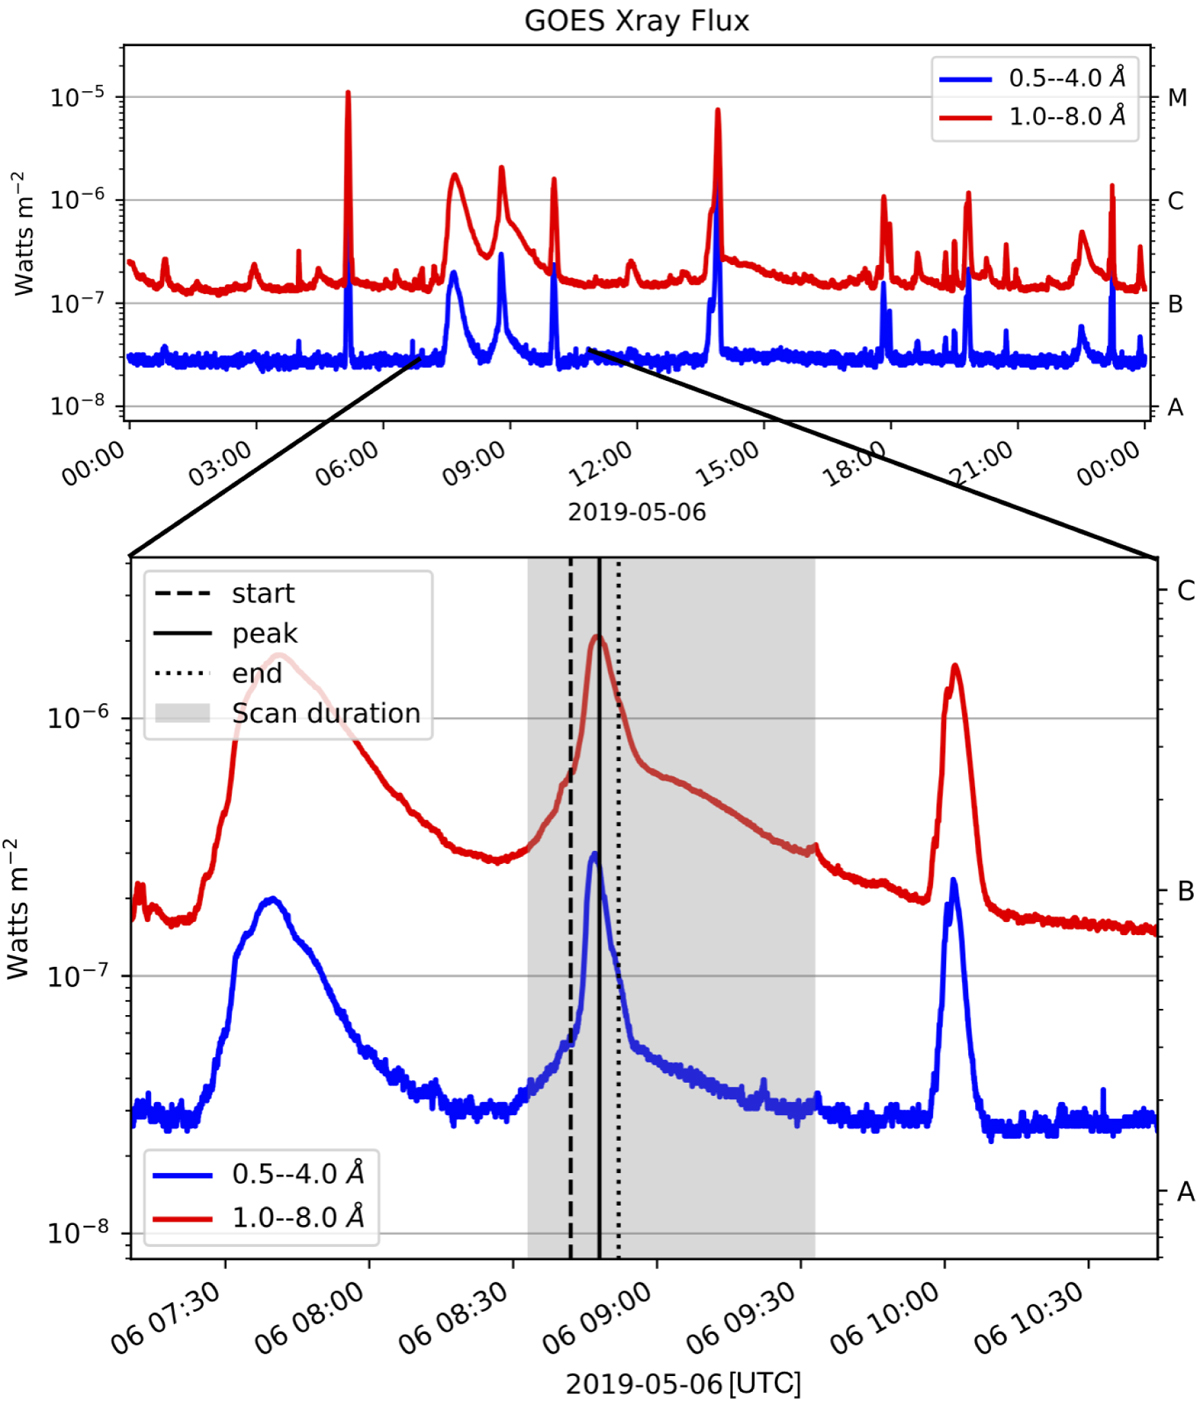
Time evolution of GOES X-ray flux observed on May 6, 2019. The vertical dashed, solid, and dotted lines refer to the start, peak, and end times of the flare, respectively. The gray shaded area indicates the observing window with the SST.
Current usage metrics show cumulative count of Article Views (full-text article views including HTML views, PDF and ePub downloads, according to the available data) and Abstracts Views on Vision4Press platform.
Data correspond to usage on the plateform after 2015. The current usage metrics is available 48-96 hours after online publication and is updated daily on week days.
Initial download of the metrics may take a while.