Fig. 6.
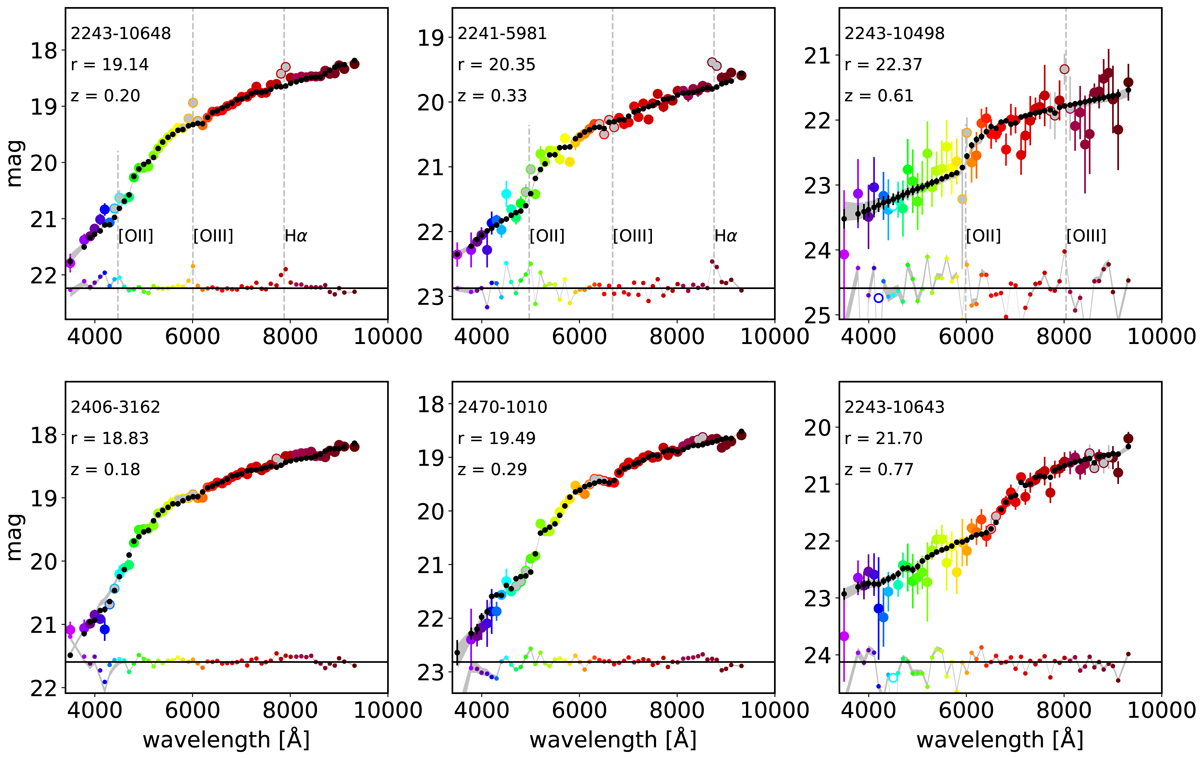
MAG_PSFCOR J-spectra of different galaxies with redshift z = 0.18 − 0.77 and brightness 19.1 < rSDSS < 22.4 (MAG_AUTO in rSDSS). Masked filters (white coloured circles) and filters overlapping with Hα, [NII], [OIII], Hβ, or [OII] lines (grey coloured circles) are not used in the fit. The best model fitted to the continuum with BaySeAGal is plotted as black points, and the grey band shows the magnitudes of the mean model at the ±1σ uncertainty level. The difference between the observed and the best model fitted magnitudes are plotted as small coloured points around the black horizontal line, which represents a null difference between the observed and the best-fitted model. The grey bands around these dots show the difference ±1σ variation.
Current usage metrics show cumulative count of Article Views (full-text article views including HTML views, PDF and ePub downloads, according to the available data) and Abstracts Views on Vision4Press platform.
Data correspond to usage on the plateform after 2015. The current usage metrics is available 48-96 hours after online publication and is updated daily on week days.
Initial download of the metrics may take a while.