Fig. A.1.
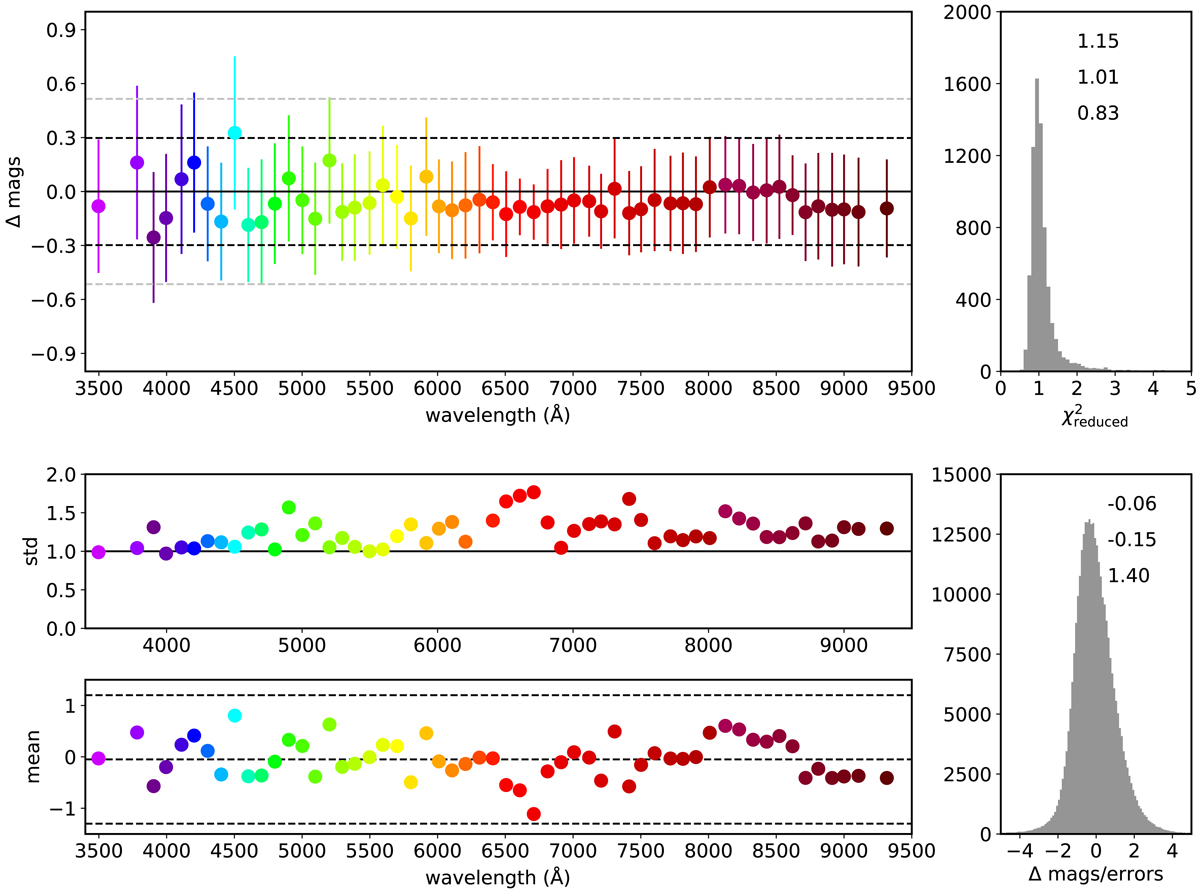
Residuals and figures of merit of the MAG_PSFCOR J-spectra fits. Top-right panel: distribution of χ2. The mean, median, and standard deviation of the χ2 distribution are indicated. Top-left panel: mean value of the difference between the observed and the best-fitting model. The error bar is the 1 sigma uncertainty level for each filter, while the dashed lines are the global averages for the 1 and 2 sigma uncertainty levels. Bottom-right panel: distribution of the ratio between Δmag and the error for all the filters and galaxies. The mean, median, and standard deviation of this distribution are indicated. Middle- and bottom-left panels: variation of the mean and standard deviation for each filter. Upper panels: are for MAG_PSFCOR, and bottom panels: are for MAG_AUTO apertures.
Current usage metrics show cumulative count of Article Views (full-text article views including HTML views, PDF and ePub downloads, according to the available data) and Abstracts Views on Vision4Press platform.
Data correspond to usage on the plateform after 2015. The current usage metrics is available 48-96 hours after online publication and is updated daily on week days.
Initial download of the metrics may take a while.