Fig. 2.
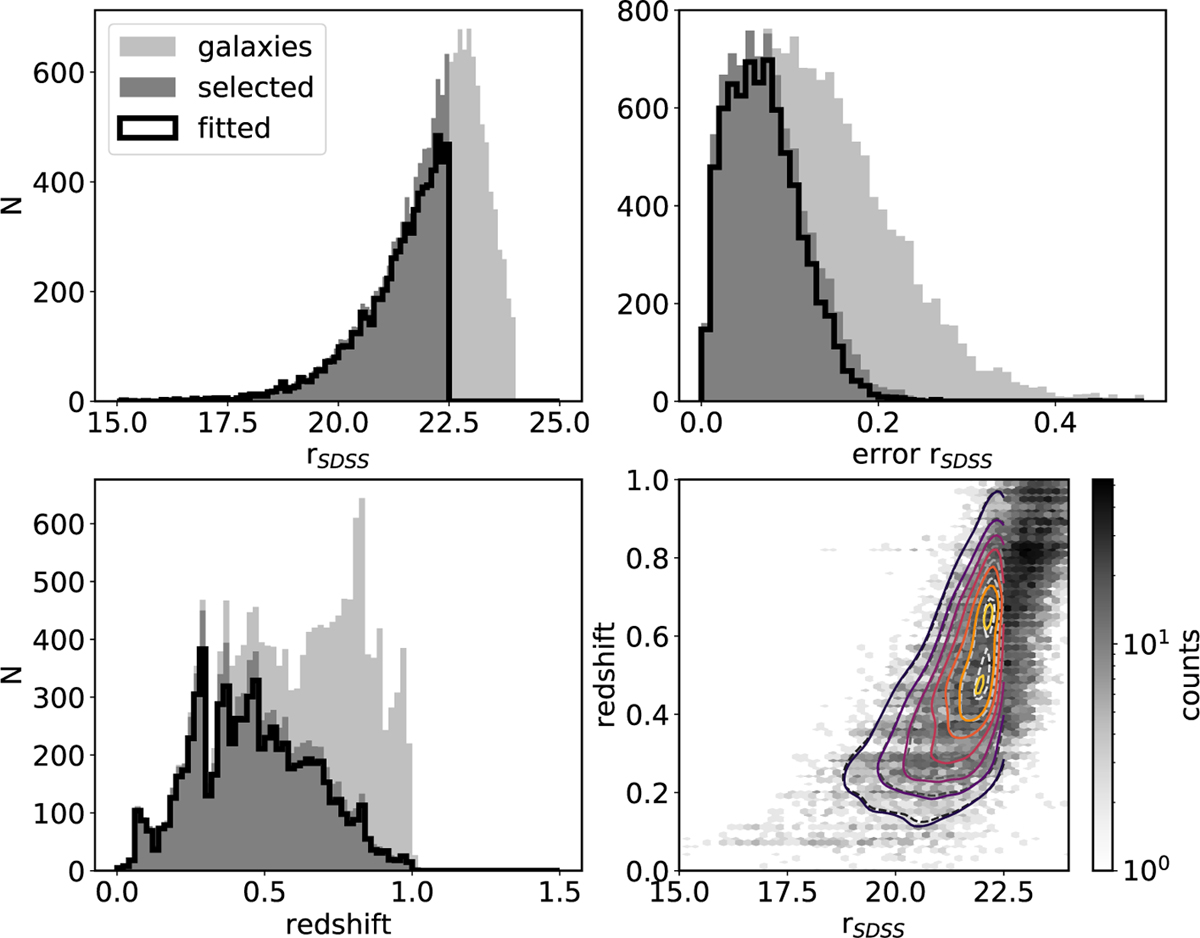
Distributions of several observational properties. Top-left, top-right, and bottom-left panels: distribution of rSDSS magnitude and errors, and redshift of galaxies with photo-z ≤ 1 identified in miniJPAS (light grey) and galaxies with rSDSS ≤ 22.5 and photo-z ≤ 1 (dark grey). The black line indicates the galaxies that were fitted. All magnitudes and related errors correspond to the MAG_AUTO photometry. Bottom-right panel: density map of the number count of galaxies with z ≤ 1, shown with the density contours of the selected sample (dashed lines) and the galaxies that were fitted (solid lines).
Current usage metrics show cumulative count of Article Views (full-text article views including HTML views, PDF and ePub downloads, according to the available data) and Abstracts Views on Vision4Press platform.
Data correspond to usage on the plateform after 2015. The current usage metrics is available 48-96 hours after online publication and is updated daily on week days.
Initial download of the metrics may take a while.