Fig. 19.
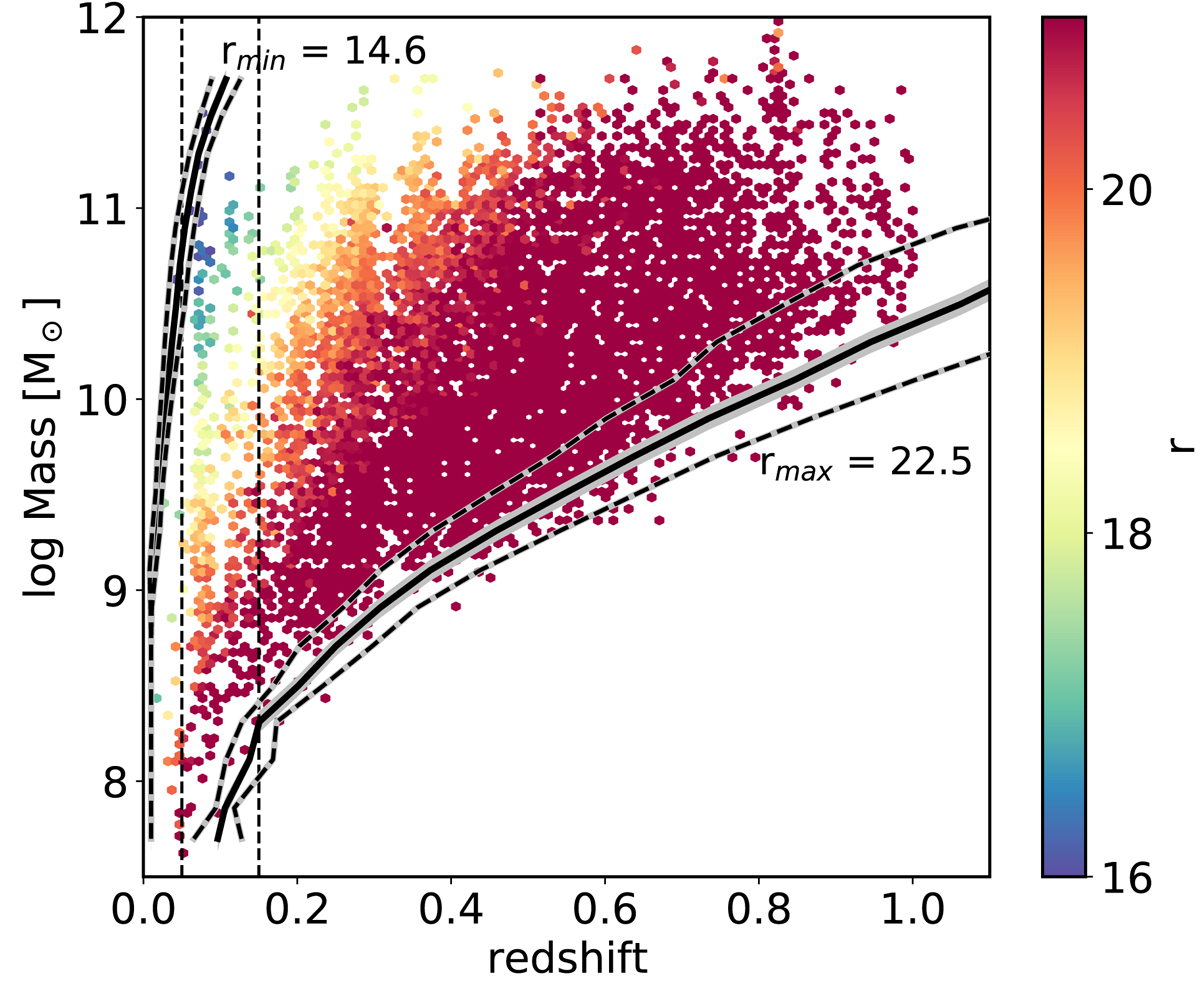
Redshifts and stellar masses obtained by BaySeAGal using the MAG_AUTO photometry for each of the galaxies in our sample. The black lines show the zmax and zmin values that correspond to the limiting magnitudes of the miniJPAS galaxy sample selection analysed here (14.6 ≤ r ≤ 22.5). The shaded regions show the dispersion of this limiting magnitude in the y-axis, and the black-grey lines the dispersion in the x-axis. The dashed lines illustrate the sub-sample of galaxies at 0.05 ≤ z ≤ 0.15 used to explore the evolution of the SFRD (ρ⋆). All the points are colour-coded according to the galaxy magnitudes in the rSDSS band and MAG_AUTO apertures.
Current usage metrics show cumulative count of Article Views (full-text article views including HTML views, PDF and ePub downloads, according to the available data) and Abstracts Views on Vision4Press platform.
Data correspond to usage on the plateform after 2015. The current usage metrics is available 48-96 hours after online publication and is updated daily on week days.
Initial download of the metrics may take a while.