Fig. 14.
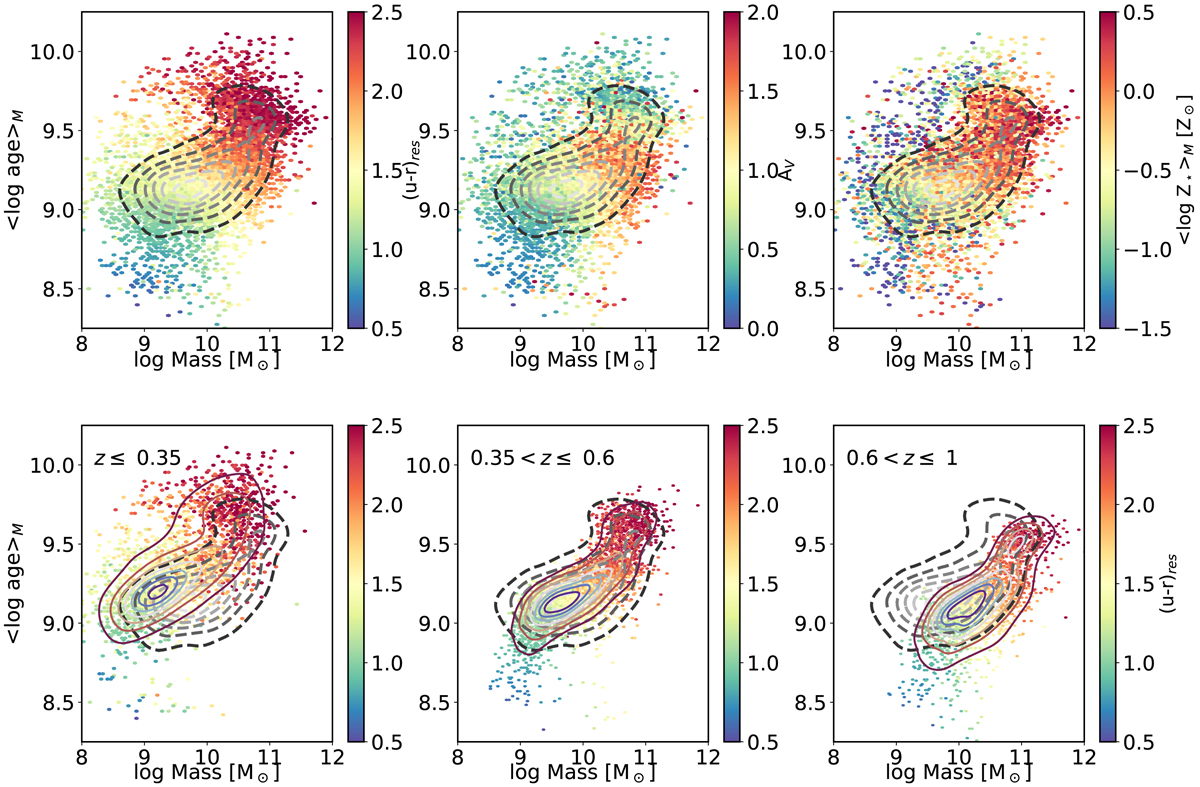
Distributions of (u − r)res, AV, and ⟨log Z⋆⟩M across the mass–age relation. The values of all the parameters are coded according to the colour bars. Bottom panels: points and contour distribution of (u − r)res in the mass–age relation at z ≤ 0.35, 0.35 < z ≤ 0.6, and 0.6 < z ≤ 1. The dashed contours show the distribution of galaxies with z ≤ 1.
Current usage metrics show cumulative count of Article Views (full-text article views including HTML views, PDF and ePub downloads, according to the available data) and Abstracts Views on Vision4Press platform.
Data correspond to usage on the plateform after 2015. The current usage metrics is available 48-96 hours after online publication and is updated daily on week days.
Initial download of the metrics may take a while.