Free Access
Fig. 1.
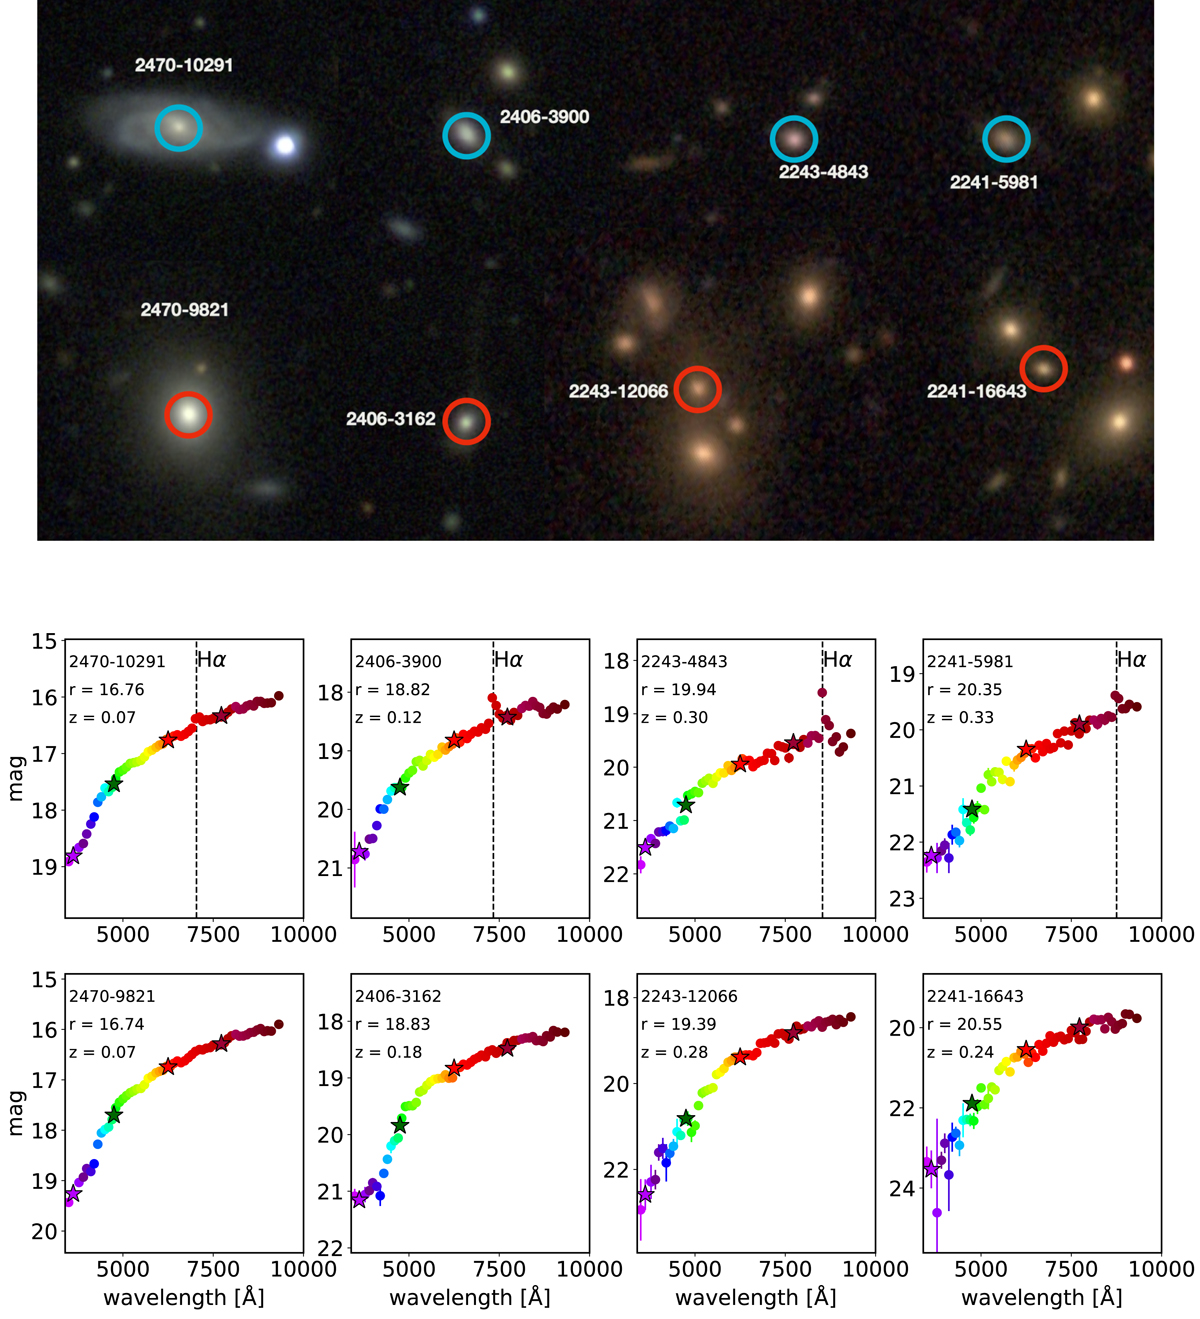
Images and J-spectra of several galaxies in the AEGIS strip. Top panels: mosaic image of red and blue galaxies. Bottom panels: corresponding J-spectra (coloured points) in MAG_PSFCOR for the galaxies above. We note the Hα emission in the BGs. The star-shaped markers are the BB magnitudes (uJAVA, gSDSS, rSDSS, and iSDSS).
Current usage metrics show cumulative count of Article Views (full-text article views including HTML views, PDF and ePub downloads, according to the available data) and Abstracts Views on Vision4Press platform.
Data correspond to usage on the plateform after 2015. The current usage metrics is available 48-96 hours after online publication and is updated daily on week days.
Initial download of the metrics may take a while.