Fig. 8
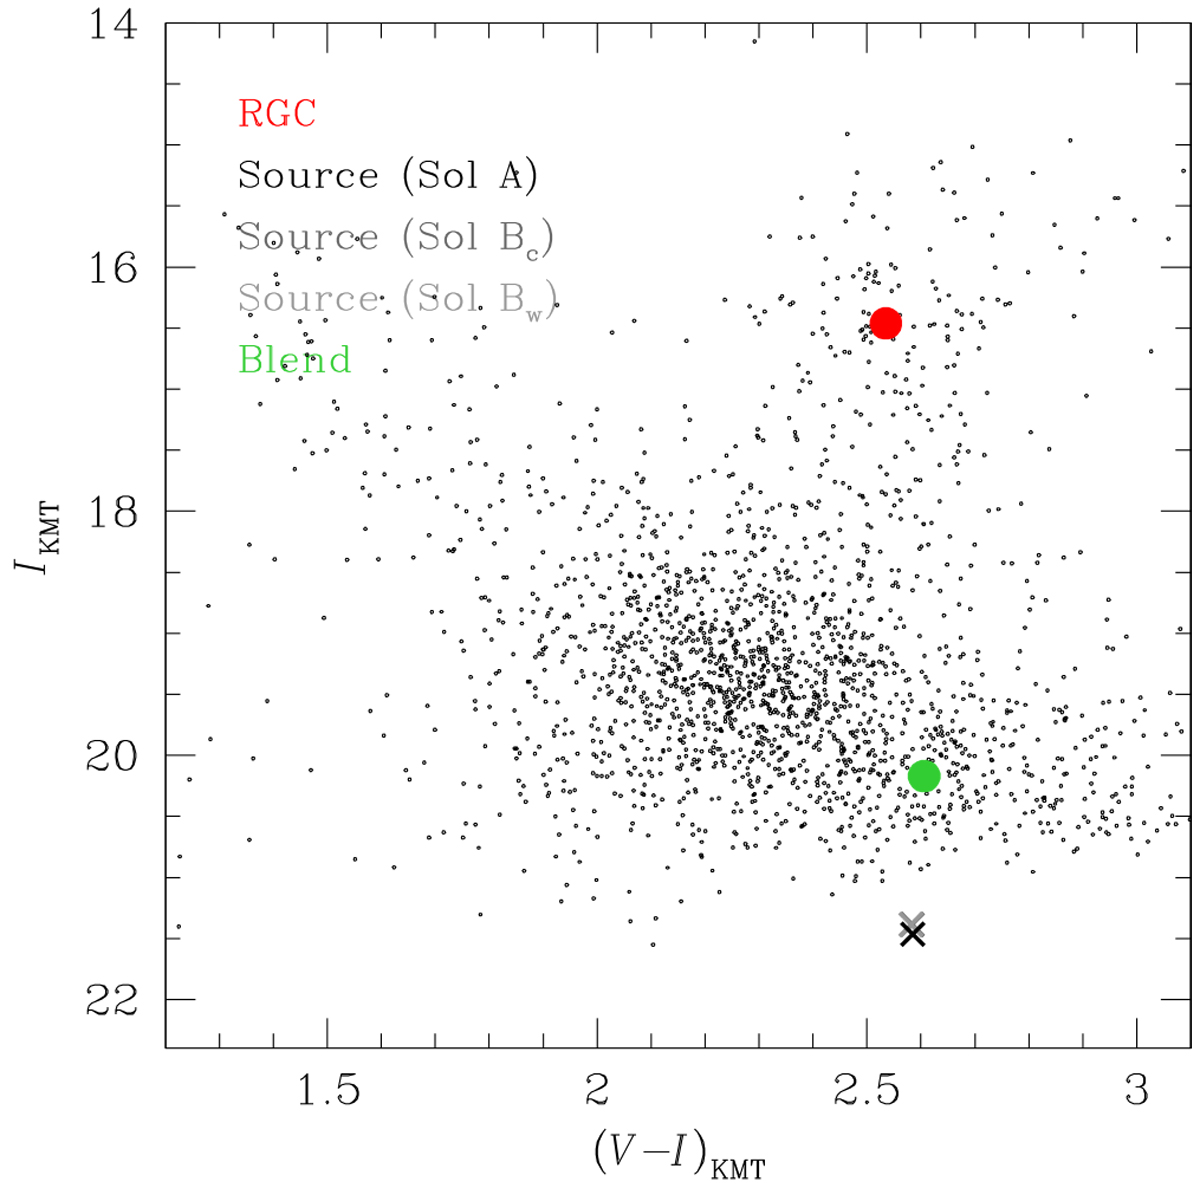
Source (cross mark) position with respect to the centroid of the red giant clump (RGC, red dot) in the instrumental color-magnitude diagram of stars lying in the vicinity of the source. We mark source positions corresponding to the three degenerate solutions, which yield very similar source locations. The position of the blend (green dot) is also marked.
Current usage metrics show cumulative count of Article Views (full-text article views including HTML views, PDF and ePub downloads, according to the available data) and Abstracts Views on Vision4Press platform.
Data correspond to usage on the plateform after 2015. The current usage metrics is available 48-96 hours after online publication and is updated daily on week days.
Initial download of the metrics may take a while.